

BDCs and the Private Credit Puzzle: How Credit Markets Enabled a $534 Billion Lending Machine
E7 - John Giordano (Seaport Global) on funding mechanics, leverage economics, PIK risks, and credit market dependency

TCP Capital wrote down 19% of NAV on loan losses—the first material markdown we've seen this cycle. First Brands and Tricolor blew up too, but those sat outside BDC portfolios. TCP's writedown is different because it happened inside a vehicle that investors thought was relatively safe. It raises questions about dividend sustainability, rising PIK income, and whether BDCs can handle falling base rates compressing their yields.
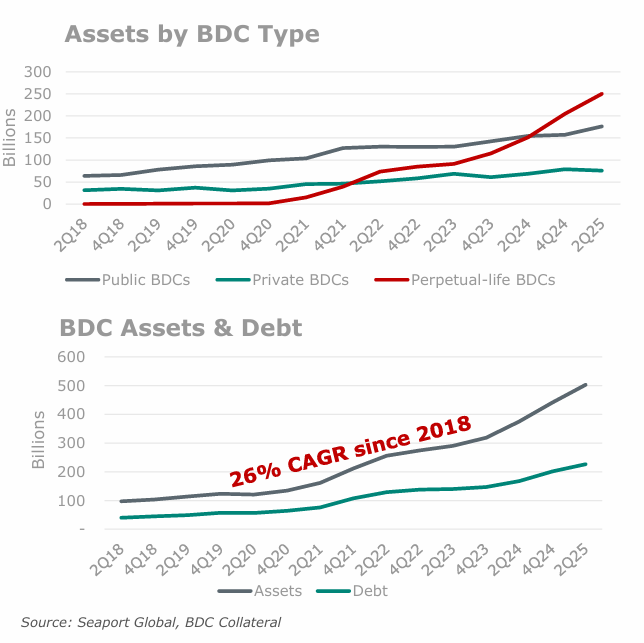
The sector grew to $534 billion by Q3 2025, expanding at 26% annually since the 2018 regulatory change that doubled leverage limits. Two factors drove growth: credit markets providing leverage at reasonable spreads, and wealth channel distribution to high-net-worth retail—doctors, dentists, advisors' clients chasing 10-12% yields in tax-advantaged structures.
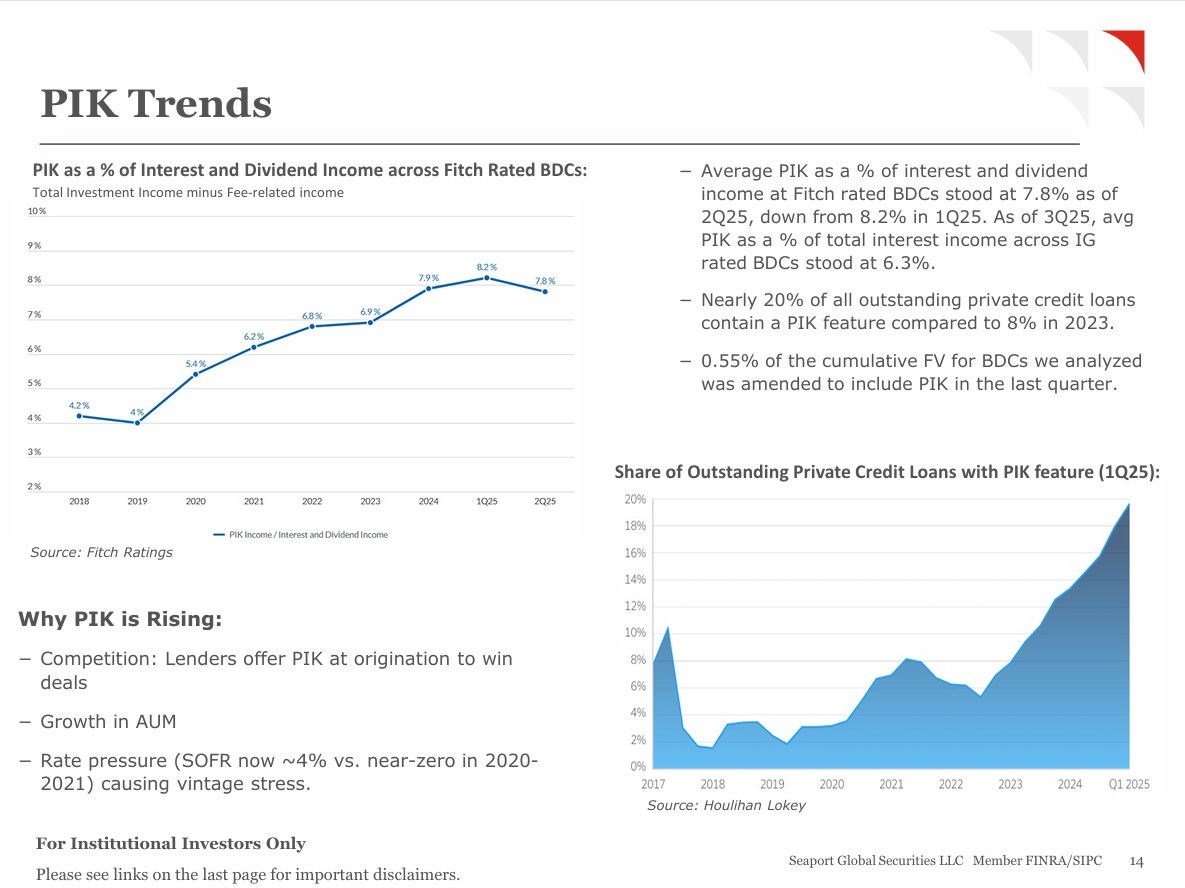
The current pressure points: PIK income hit 7.8% of total income, up from 4.2% in 2018. SOFR fell 165bps since mid-2023. Dividend coverage sits at 1.05x on average—not much cushion. Software makes up 20% of portfolios, and public exit markets have been essentially closed since late 2021.
Episode 6 with John Giordano (Seaport Global) highlights the key aspects of the BDC market.
Three Structures, Different Capital Raising
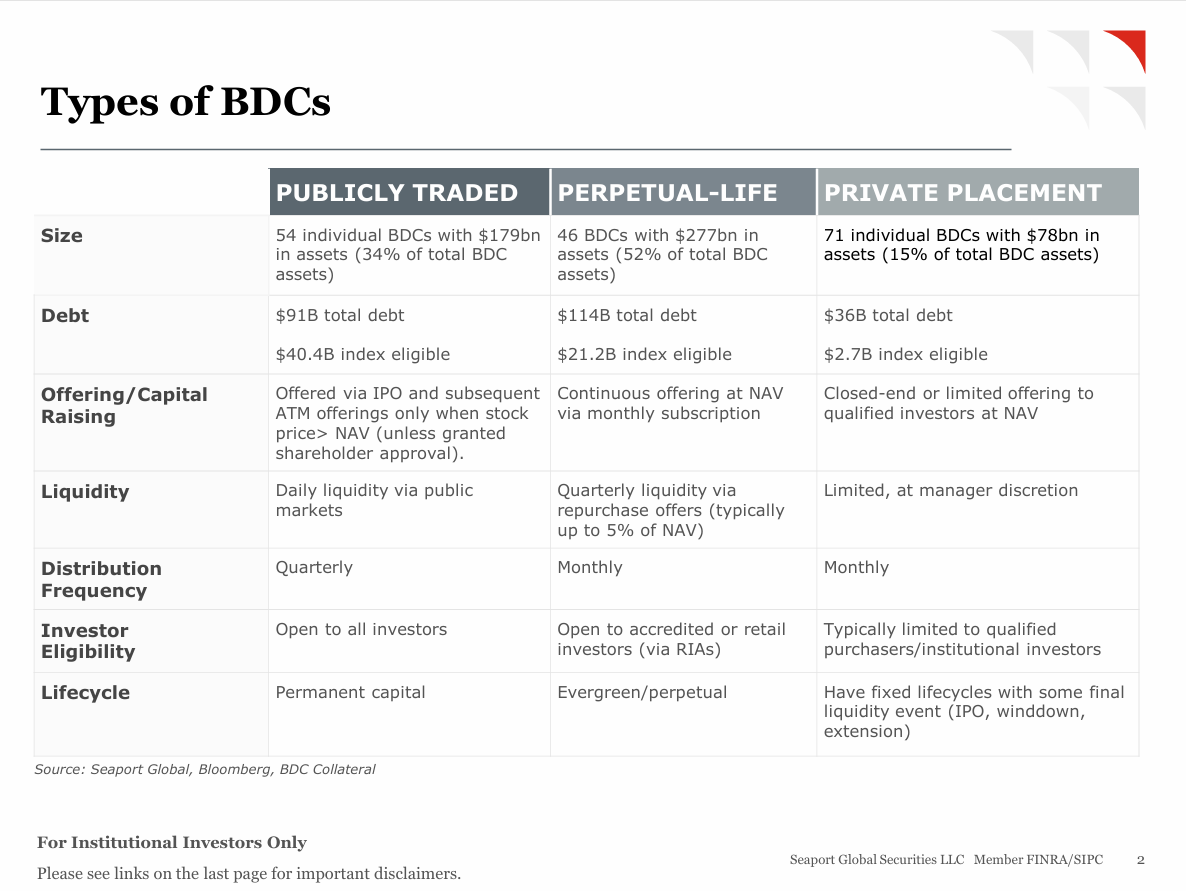
BDCs come in three flavors:
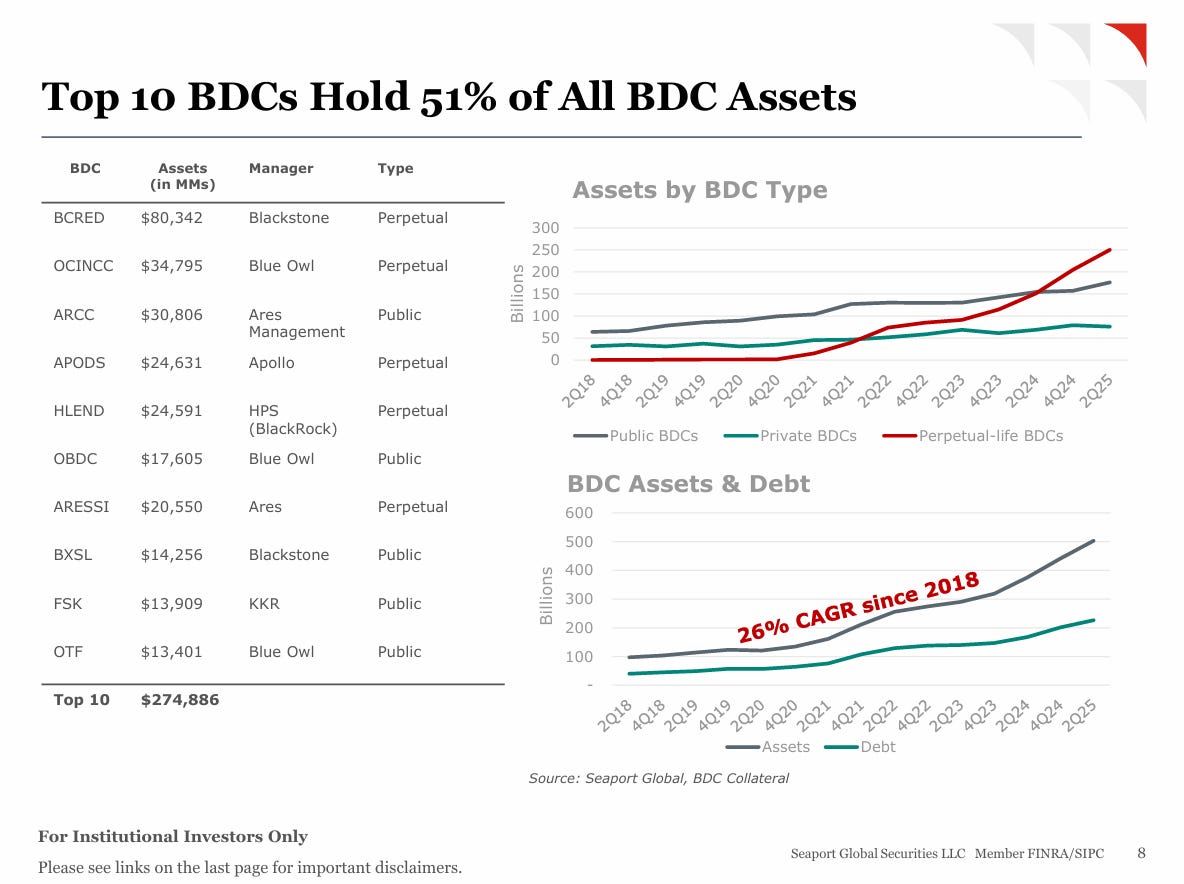
Publicly traded BDCs hold $179 billion in assets, about 34% of the total market. These issue equity through IPOs and at-the-market offerings, but there's a catch: they can only issue new equity when the share price trades above NAV.
Perpetual-life BDCs are the fastest-growing segment at $277 billion in assets, representing 52% of the market. They conduct continuous offerings at NAV through monthly subscriptions, which eliminates the price-to-NAV constraint that public BDCs face. Quarterly redemptions are typically capped at 5% of NAV, though managers can remove that gate at their discretion. Going from zero to $277 billion in five years is remarkable growth, enabled by the structural advantage of NAV-based capital raising.
This is where the wealth channel story really matters. Financial advisors pitch these to high-net-worth clients—dentists, doctors, lawyers, business owners looking for yield. Monthly distributions (instead of quarterly like public BDCs) fit the income-oriented investor profile better. In 2023, roughly 30% of perpetual BDC assets came from RIA accounts. The combination of tax pass-through treatment, monthly income, and semi-liquidity (quarterly redemptions versus fully locked private funds) made perpetuals the go-to vehicle for accessing private credit through the wealth channel.
Private placement BDCs are the smallest segment at $78 billion, or 15% of assets. These are closed-end with fixed lifecycles, targeting institutional investors. They offer limited liquidity and finite duration, but they also avoid the perpetual redemption pressures that can create problems.
All three structures face the same leverage constraints (2:1 maximum) and distribution requirements (90% of taxable income must be paid out). What differs is liquidity and how they raise capital.
Why Wealth Channel Investors Bought In
The high-rate environment of 2022-2024 drove massive flows into BDCs, and the yield comparison tells you why. When SOFR hit 5.3% and direct lending spreads averaged 550bps, total portfolio yields reached 10-12%. For wealth channel investors comparing alternatives, the numbers looked compelling:
Investment-grade bonds: 5-5.5%
High-yield bonds: 7.5-8.5%
Equity dividends: 1.5-2%
BDC distributions: 10-12%
Add the tax pass-through treatment—no corporate-level tax before the distribution reaches shareholders—and the pitch practically made itself. Financial advisors positioned BDCs as “access to private credit returns” with “semi-liquid monthly income.” For their clients, that sounded a lot better than settling for 5% on investment-grade corporates.
The typical investor profile matters here: high-income professionals (dentists, doctors, lawyers), business owners, retirees seeking yield. These aren’t sophisticated credit analysts evaluating PIK ratios and non-accrual trends. They’re looking at the distribution rate and comparing it to what bonds pay. That’s the decision framework.
This matters for understanding the redemption dynamic. When distribution rates fell below 10% in Q4 2025 (from falling SOFR), investors didn’t need to understand credit deterioration to start pulling money. The yield comparison alone had changed. If BDC yields drop to 8-9% while investment-grade corporates offer 5-6%, the premium narrows from 600bps to 300bps. At that point, the illiquidity and complexity don’t justify the reduced spread.
Blue Owl’s 18% redemption requests probably reflect this as much as credit concerns. Investors bought in for 12% yields. When it drops to 9%, they reassess whether it’s worth the hassle.
The Economics: P&L Structure
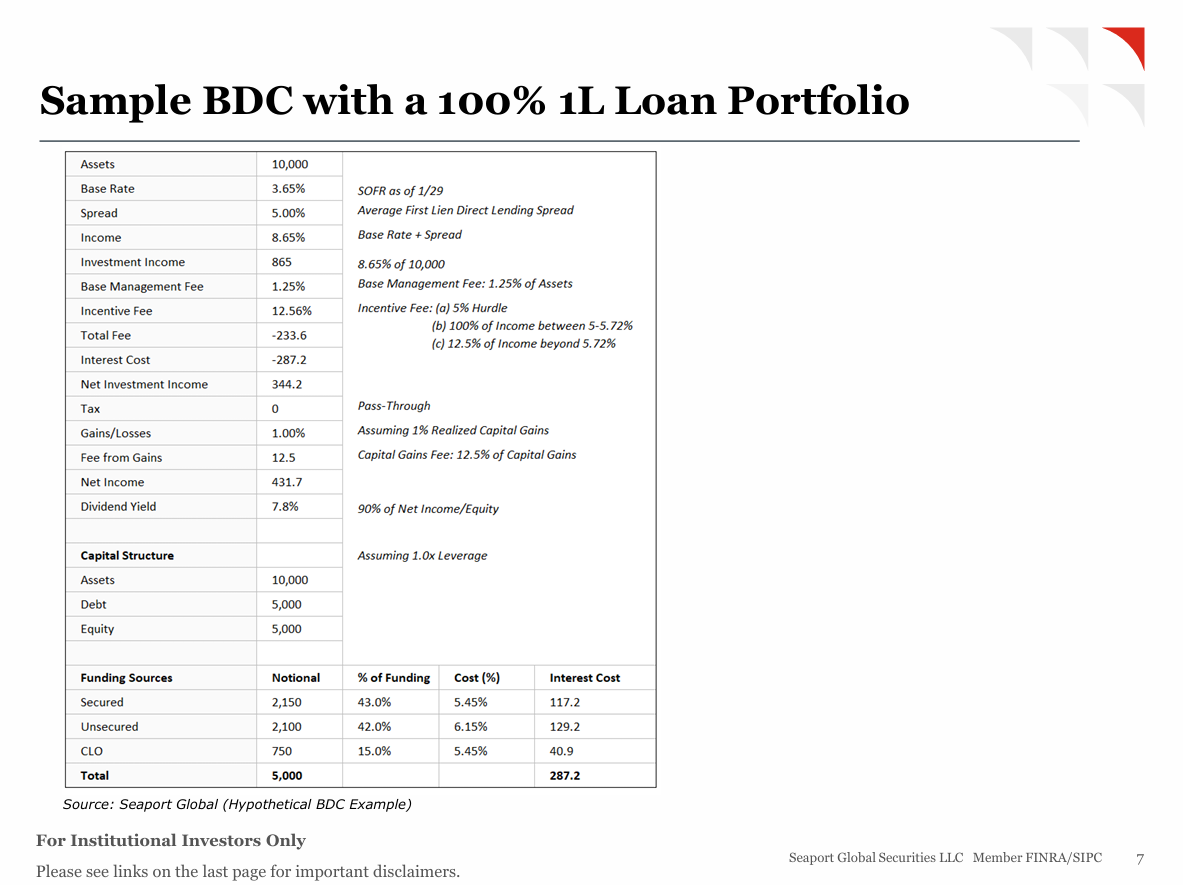
Take a $10 billion BDC at 1:1 leverage with first-lien loans. SOFR sits at 3.65%, direct lending spreads average 500bps. Total yield: 8.65%. Investment income: $865 million.
Management fees (1.25% base plus incentive structure): $234 million. Funding costs on $5 billion debt (mix of secured facilities at 5.45%, unsecured bonds at 6.15%, CLOs at 5.45%): $287 million. Net investment income: $344 million.
Add some realized gains, subtract another incentive fee slice, distribute 90% to equity holders. You get a 7.8% dividend yield on the $5 billion equity base.
The dependencies:
Spread compression: Direct lending tightened from 550bps to 500bps over two years. Every 25bps cut takes 7% off distributable income.
Base rate moves: SOFR cuts hit both sides—investment income falls, but so do RCF and CLO borrowing costs. Partially offsetting, but the net effect is negative when spreads don’t widen to compensate.
Fee drag: Management fees eat 27% of gross investment income. Tied to AUM, not performance.
Funding arbitrage: The model needs positive spread between 8.65% asset yields and 5.74% blended funding costs. Credit market pricing sets profitability.
Capital Structure: Funding Mix
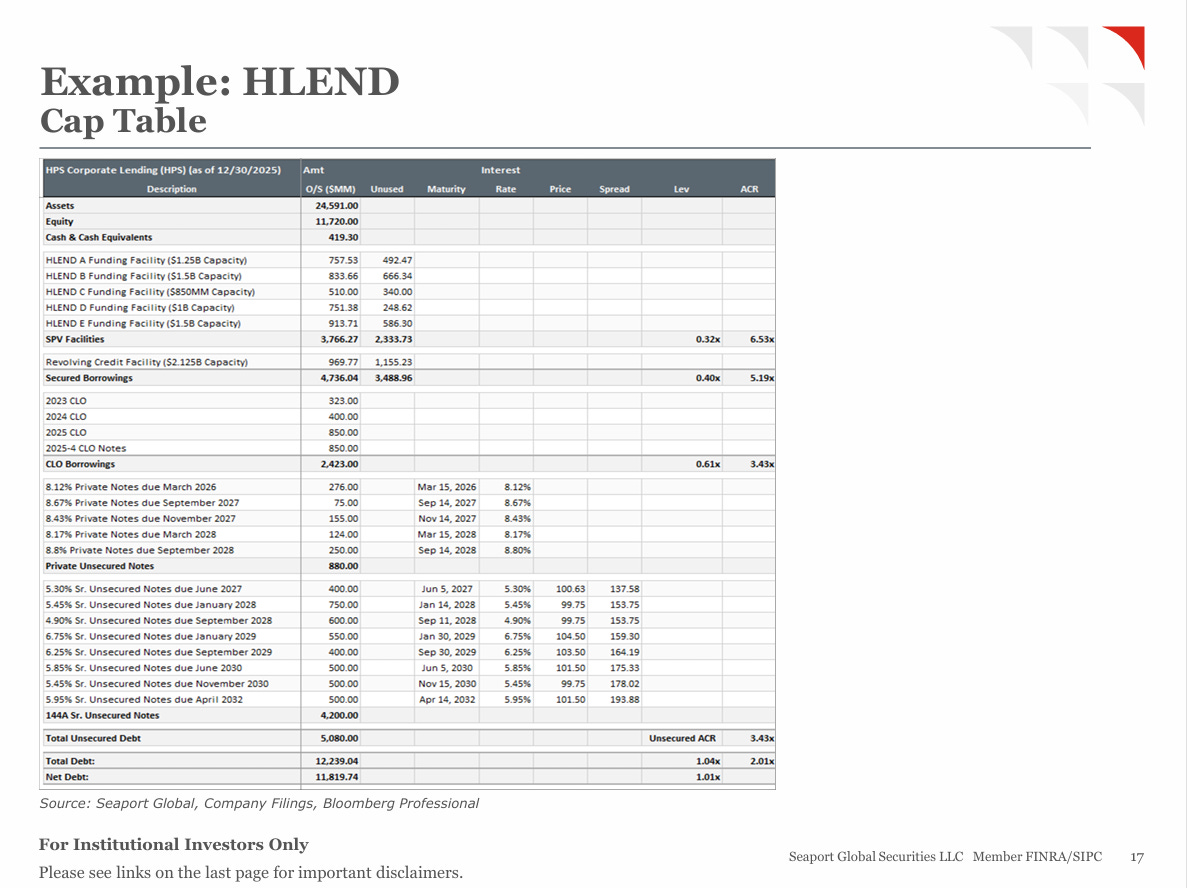
Looking at HPS Investment Partners’ HLEND shows how typical BDC funding works in practice. The numbers: $24.6 billion in assets, $12.3 billion in equity, $12.3 billion in debt (1:1 leverage). That debt comes from multiple sources: $3.2 billion in secured credit facilities, $2.8 billion in CLO issuance, $4.1 billion in unsecured notes (paying 5.5-6.5%), $1.2 billion in short-term subscription facilities, and $1.0 billion in private placements.
Even the unsecured bondholders—the ones lowest in the capital structure—sit behind 3.4x asset coverage. That’s meaningful protection.
Banks like lending to BDCs for exactly this reason. Even unsecured lenders have substantial asset coverage providing loss absorption, and from a regulatory capital perspective it’s attractive lending—you get decent risk-adjusted returns without extreme capital charges.
The unsecured debt expansion follows the playbook that REITs pioneered. Issue bonds to unencumber assets. Rating agencies reward unencumbered collateral with better ratings. Better ratings mean lower funding costs, which enables more competitive loan pricing or higher equity returns. Unsecured debt now makes up 42% of BDC funding, up from almost nothing a decade ago. That shift happened because it works—ratings improved from low BBB to mid BBB during 2024-2025 as asset coverage improved and track records lengthened.
Here’s where the leverage multiplier becomes important. At 2:1 leverage, $1 billion in new equity plus $2 billion in new debt enables $3 billion in loan originations. Credit markets accommodating BDC debt growth at reasonable spreads (sub-6% for unsecured paper) directly enabled the expansion of private lending. Without debt investor appetite at those levels, the sector doesn’t scale the way it did.
Regulatory Framework
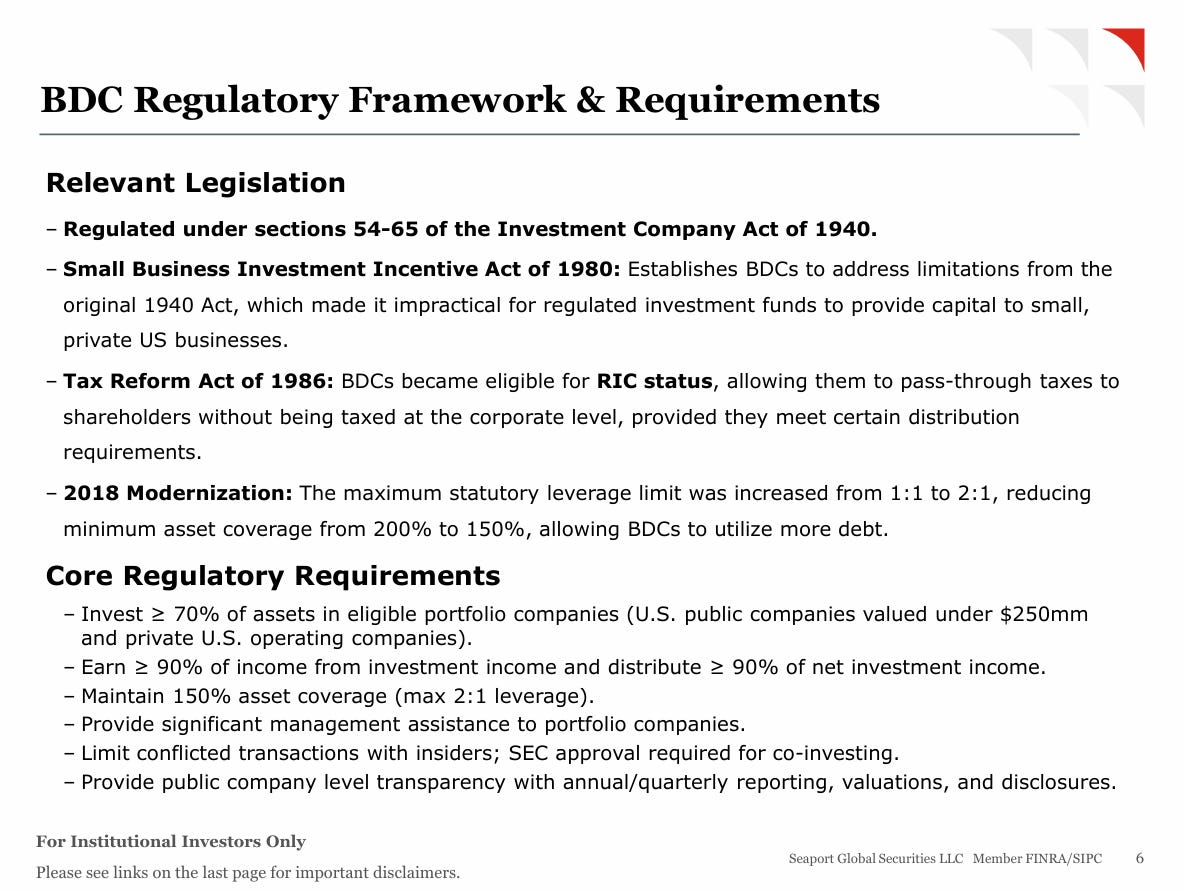
Three rules define how BDCs operate:
First, at least 70% of assets must go into eligible portfolio companies—US companies under $250 million market cap or private operating businesses. Second, they must distribute at least 90% of net investment income, which means they can’t retain capital to fund growth organically. Third, they need to maintain 150% asset coverage minimum, which translates to a maximum of 2:1 debt-to-equity leverage.
The 2018 regulatory change cut minimum asset coverage from 200% to 150%, effectively doubling allowable leverage from 1:1 to 2:1. In practice, the industry runs more conservatively—average leverage sits around 1.2:1. Most BDCs preserve cushion for mark-to-market volatility and potential credit losses rather than pushing right up against the regulatory maximum.
There’s a gap between regulatory leverage and total economic leverage that matters for credit analysis. The regulatory calculation excludes preferred equity, which carries mandatory distributions like debt but doesn’t count toward leverage ratios. Rating agencies use broader measures that capture all fixed obligations.
Prospect Capital’s 2023 downgrade from investment grade to high yield shows what happens when that gap gets too wide. The company issued substantial preferred equity to fund dividend payments while underearning the distributions it was making. Regulatory leverage looked compliant, but the economic leverage triggered a downgrade. Funding costs spiked immediately, which made the whole situation worse.
The 90% distribution rule creates the fundamental structural constraint. BDCs can’t build equity capital organically through retained earnings. Growth requires accessing capital markets—either raising equity (for public BDCs trading above NAV or perpetuals conducting continuous offerings) or issuing debt (constrained by that 2:1 leverage limit). This makes them dependent on sustained market access in a way that most corporates aren’t.
Portfolio Composition
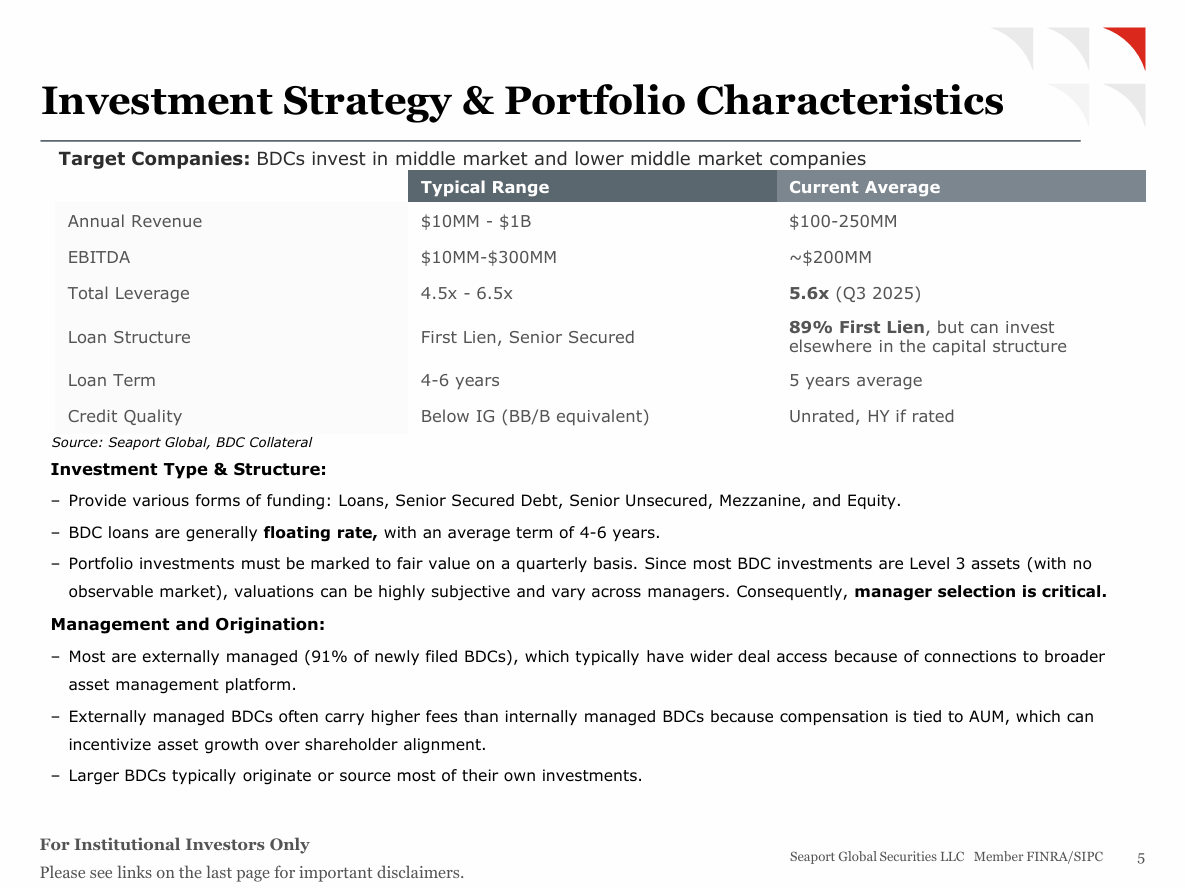
Current BDC portfolios run 89% first-lien senior secured, with average borrower leverage at 5.6x EBITDA as of Q3 2025. That compares to 4.9x back in Q3 2017—a 17% increase that reflects how competitive underwriting has become as more capital chased the same deals. Most portfolios consists of loans made to middlemarket companies, with a liquid buffer, consisting of BSLs and cash.
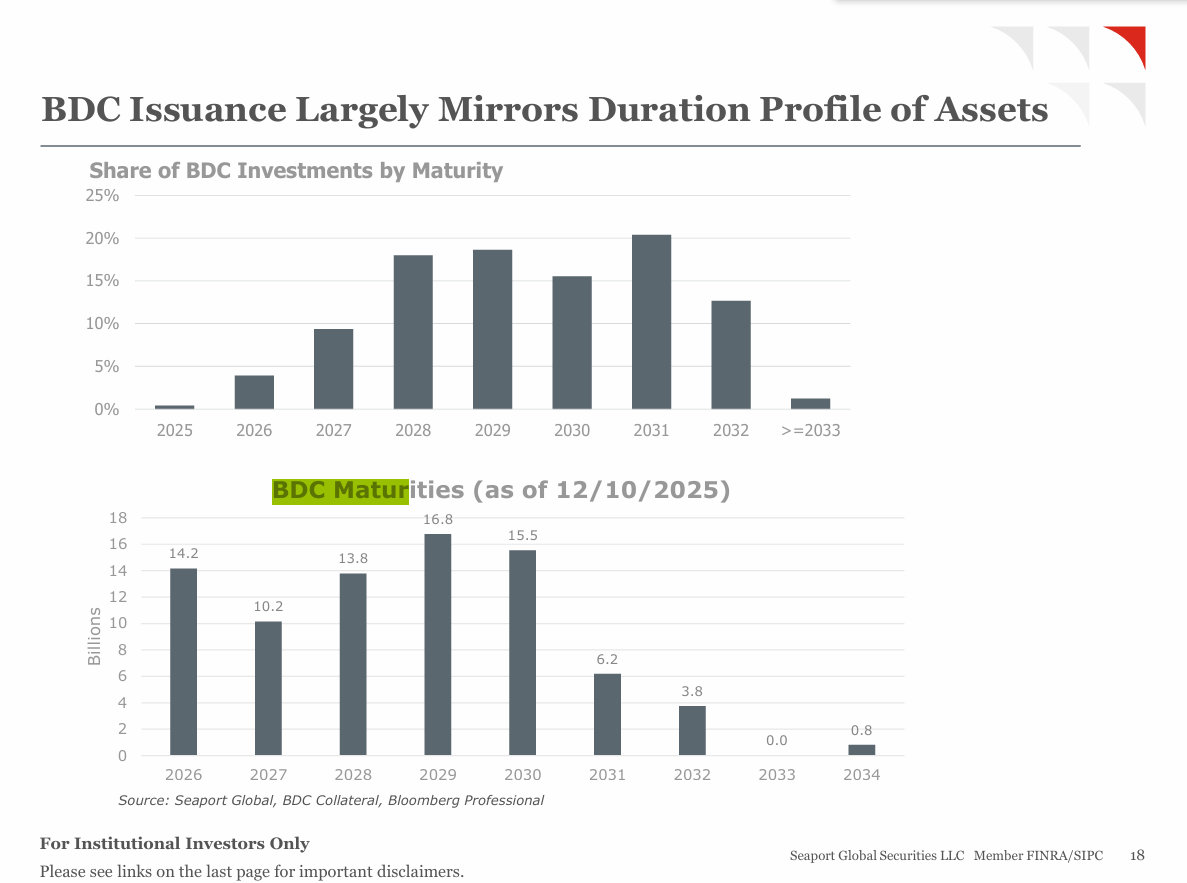
The loans themselves are floating rate with 4-6 year terms. You’re getting SOFR (currently 3.65%) plus a spread that averages 500bps for direct lending versus 380bps for broadly syndicated loans. That 124bp premium compensates lenders for providing more flexibility (PIK options, higher leverage, looser covenants) and accepting less liquidity.
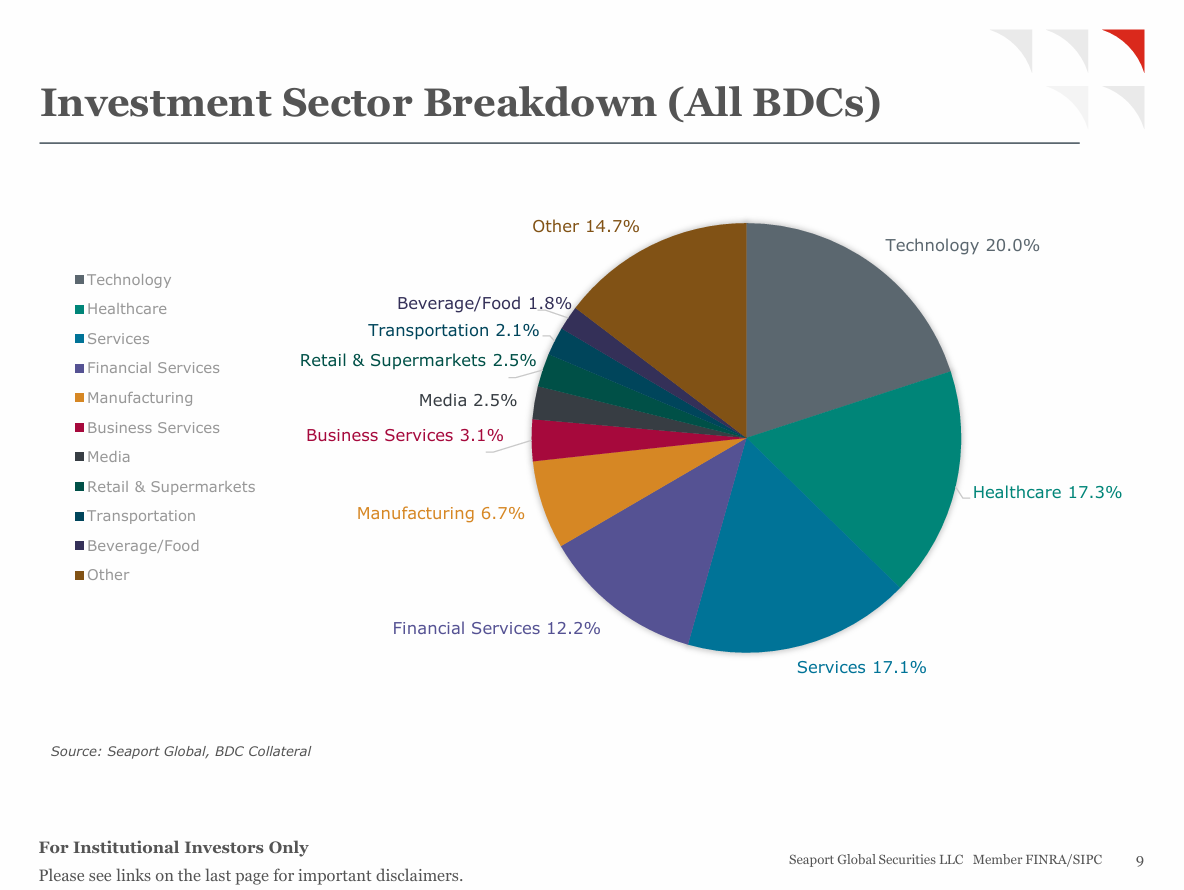
Sector concentration matters: technology represents 20% of portfolios, healthcare 17.3%, business services 17.1%. About 70-75% of direct lending volume finances private equity-sponsored transactions, which creates dependence on M&A activity and the roughly $2 trillion in PE dry powder (per Ares Management data cited in the Seaport primer). When PE deal activity slows down, BDC origination slows with it.
PIK: The Real Pressure Point
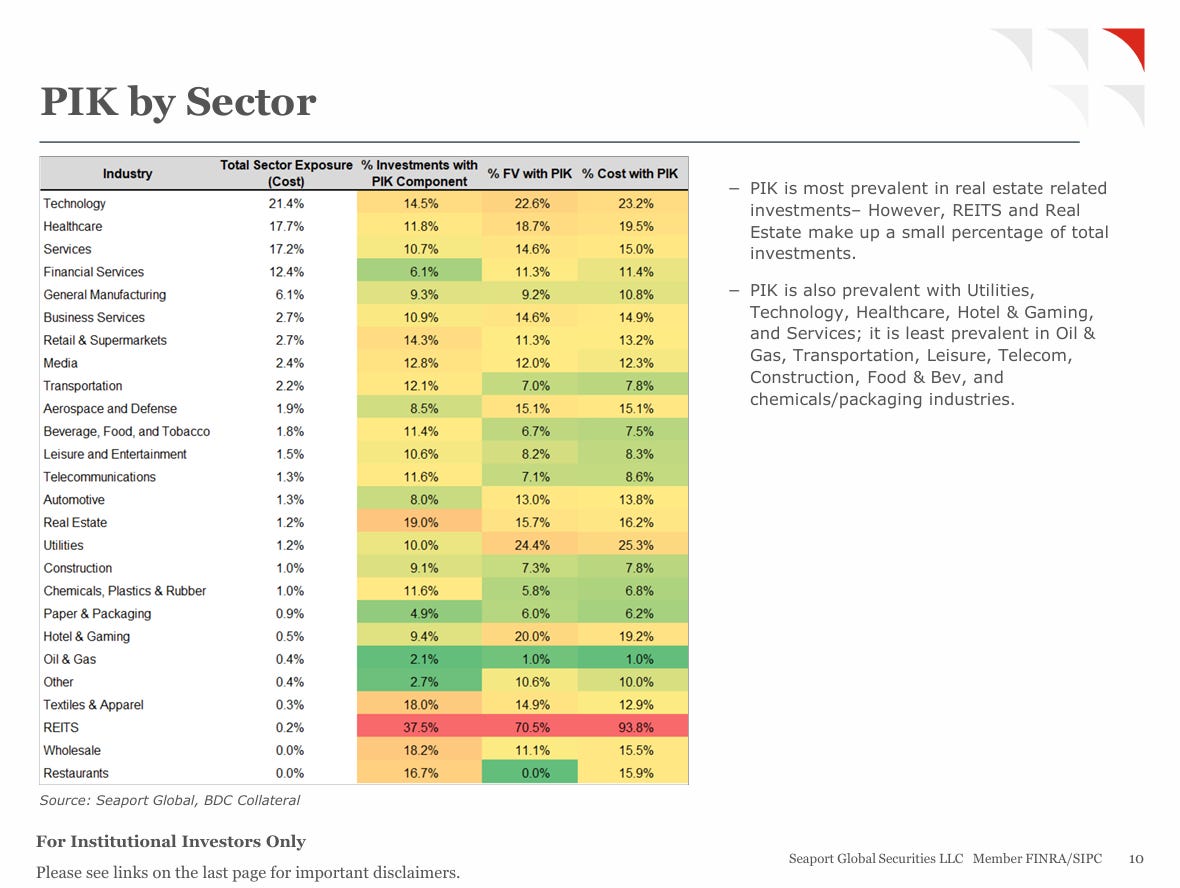
PIK income—interest that accrues to principal instead of being paid in cash—hit 7.8% of interest and dividend income in Q2 2025, up from 4.2% in 2018 per Fitch. This is where the stress shows up.
There are two types, and they mean very different things:
Intentional PIK (structured at origination): This gets built into loan terms at closing. Borrowers get 2-year optionality to defer 10-25% of cash interest while they’re growing. You see this concentrated in tech and healthcare where companies have recurring revenue that eventually converts to cash. It’s structural flexibility that banks typically can’t or won’t offer, and it’s not inherently problematic.
Amended PIK (via restructuring): This is the bad kind. The borrower can’t meet the original cash payment terms, so they go back to the lender and restructure. It’s shadow default management—converting troubled loans to PIK status avoids triggering non-accrual classification. Lincoln International estimated that amended PIK made up 57% of total private credit PIK in Q1 2025. That’s the worrying number.
Here’s the bind PIK creates: it counts as taxable income under the 90% distribution rule, but it generates zero cash. If PIK gets too high, BDCs have to fund their cash dividends through asset sales, additional borrowing, or eventually cutting the dividend.
Dividend coverage averages 1.05x across the sector. That means BDCs are generating $1.05 in NII for every $1.00 they’re paying out. Not much cushion. When PIK rises above 10% of total income, that coverage deteriorates quickly. A BDC can report strong NII on paper, but if it’s heavily non-cash PIK, they can’t actually sustain the dividend without bringing in cash from somewhere else—selling assets or borrowing more.
Looking at the largest BDCs: BCRED, ARCC, APODS, HLEND, BXSL are all at their highest PIK levels since the end of 2022. Blue Owl’s BDCs historically ran high PIK but have been declining recently. FSK, BCSF, HTGC, NMFC, and CGBD show the highest PIK proportions right now.
The market’s already pricing this in. Public BDCs trade at 0.88x NAV versus a 0.93x historical average—a 12% discount. When NAV discounts persist like this, it usually means investors expect dividend cuts down the road, especially when non-cash PIK keeps increasing and credit quality starts deteriorating.
Here’s how it plays out: if enough PIK stops accruing because borrowers are actually in trouble, NII drops. NAV gets marked down. The dividend becomes unsustainable relative to actual cash coming in. Eventually management has to cut the dividend to align what they’re paying out with what they’re actually earning in cash.
The real trigger isn’t credit markets refusing to refinance BDC bonds. It’s PIK hitting levels that make the cash dividend math impossible, combined with falling SOFR crushing the absolute yield on these floating-rate portfolios.
Falling Rates: The Dividend Compression
BDCs are income products heavily weighted to floating-rate debt. During Q4 2025, average distribution rates for NAV BDCs fell below 10% for the first time since September 2023.
The math is straightforward. Portfolio yields track SOFR plus spread. SOFR fell from 5.3% in July 2023 to 3.65% now—165bps off the top line. Spreads tightened at the same time, from 550bps to 500bps. Combined hit: 215bps of yield compression.
Funding costs also fell (RCFs and CLOs reprice down with SOFR), but the net effect is still negative. Lower absolute yields mean lower distributable income. Unless BDCs lever up or capture wider spreads, dividends have to come down.
This isn’t a credit event. It’s just rate arithmetic. Investors bought these things for yield. When yields drop from 12% to sub-10%, redemption requests follow. Blue Owl’s 18% redemption request (versus the 5% quarterly cap) reflects this dynamic as much as any credit concerns.
The combination—rising PIK eating into cash coverage plus falling base rates compressing absolute yields—creates the dividend cut pressure. NAV discounts widen as the market anticipates lower payouts ahead.
Credit Quality Signals
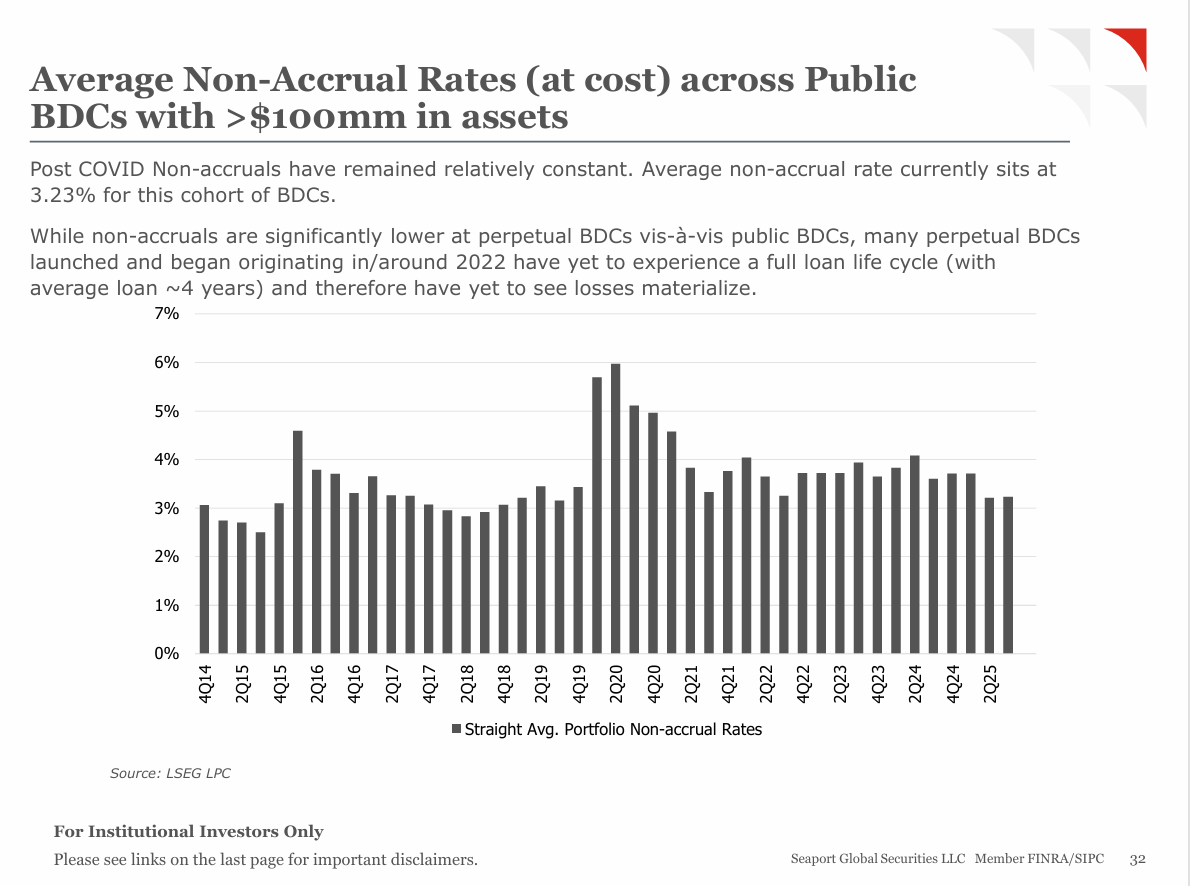
Non-accruals (loans that are 90+ days past due) average 3.23% across public BDCs with over $100M in assets. That compares to 2-3% during the 2017-2019 period and 5-6% during COVID. Perpetual BDCs report lower non-accrual rates (1-2%), but many of these launched around 2022 and haven't been through a full 4-6 year loan cycle yet.
Fitch's Q4 2025 data shows a 5.6% default rate across 1,200 US private debt borrowers on a trailing 12-month basis, with a 300-loan rated subset hitting 9.2%. Healthcare providers led all sectors with 12 defaults.
Investment marks tell you where managers think things stand. First-lien positions hover near 98% of par, while second-lien investments (which represent 8.8% of portfolios) drop to 92-94%. When marks fall below 95% and start showing increasing volatility quarter-to-quarter, that often signals trouble ahead—loans migrating toward non-accrual status.
The interplay between PIK and non-accruals matters. When you see non-accruals rising while PIK declines (like at PSEC, FSK, MFIC, OCSL), it suggests PIK loans migrated to non-accrual status. The reverse pattern—non-accruals falling while PIK rises, like at CGBD—may indicate restructuring activity to improve the optics.
The Software Problem
Technology makes up 20% of BDC portfolios, heavily concentrated in software businesses. Here’s the issue: software companies that would normally exit through an IPO or strategic sale are stuck. Public market IPO windows have been essentially closed for software since late 2021.
Private valuations still hold up on paper—hence those 98% marks—but actual realizations aren’t happening. PE sponsors can’t exit, which means their portfolio companies can’t refinance existing debt or pay it down. This creates rollover risk: when these loans mature in 2026-2027, will borrowers have the cash flow to pay them off, or will they need extensions and amendments (which often means more PIK)?
Software exposure varies across BDCs, but the largest holders exhibit meaningful concentration—HLEND, for instance, has 22% allocated to technology, with several others exceeding 20%. The critical factor lies with the private equity sponsors holding these software assets: declines in public market valuations rarely prompt immediate exits or writedowns. Yet recent SaaS growth has stabilized valuations overall. Recent SaaS growth has bolstered EBITDA figures, enabling multiples to contract while maintaining stable enterprise values; for lenders, the equity cushion beneath the debt remains the primary buffer. The worst-case outcome—declining revenues and profits alongside multiple compression—would impair asset owners and disproportionately pressure BDCs as the most exposed senior lenders.
For further reading i encourage this excellent post.

What Actually Breaks
The risk isn't credit markets refusing to refinance BDC bonds. Most unsecured debt runs 3-7 year maturities, which provides cushion against short-term market dislocations. BDCs aren't Lehman—they're not rolling overnight repos that can disappear in a crisis.
The real pressure comes from a different loop entirely:
Equity pullback triggers reflexivity. If private debt falls out of favor—whether from dividend cuts, NAV markdowns, or PIK blowups—equity stops flowing into perpetual BDCs. These continuous offering structures depend on sustained investor demand. When redemptions exceed new subscriptions, the whole machinery goes into reverse.
Redemption cascade without credit tightening. Perpetual BDCs manage redemptions by holding liquid BSL loans (~33% of portfolios for many). But if redemption requests hit 15-20% (Blue Owl saw 18%), even those liquid loans get sold at discounts to generate cash quickly. Those sales establish market prices that everyone else has to respect. Marks adjust downward across all holders of similar credits. Lower marks trigger more redemption requests from other investors.
Spread widening follows, doesn’t lead. As equity dries up and redemptions mount, BDC credit spreads widen—not because the underlying credit fundamentals changed, but because the refinancing outlook shifts. If a BDC can’t raise equity and faces heavy redemptions, it can’t lever up to grow. At the margin, some paper doesn’t get refinanced on attractive terms when it matures.
The broader pullback. Private debt doesn’t just sit in BDCs. It’s spread across insurance company portfolios, pension allocations, sovereign wealth funds, and other structures. Opaque capital treatment helped fuel the boom—revolving credit facilities get favorable bank capital treatment, while unrated or BBB-rated private debt carries low insurance capital charges. This regulatory arbitrage made the asset class attractive to everyone. If that reverses—either through regulatory changes or internal risk reassessment—the whole ecosystem contracts at once.
John didn’t talk much about this reflexivity loop in the transcript. He focused more on PIK trends, non-accruals, and credit quality metrics. But the structural risk isn’t credit markets closing to BDC debt issuance. It’s equity markets closing to BDC equity raising, which forces redemption-driven asset sales, which establishes lower marks in the market, which triggers even more redemptions. That’s the real vulnerability.
Structural Protections
Several factors do provide meaningful downside protection:
Asset coverage: Average unsecured coverage sits at 3.0-3.5x, which creates substantial loss absorption capacity. Even if asset values decline by 30%, unsecured bondholders would still be made whole.
First-lien concentration: That 89% senior secured positioning provides real recovery protection. Private credit historically sees better recoveries than broadly syndicated loans because of tighter covenant protections and direct lender-borrower relationships that allow for faster workouts.
Conservative leverage: The industry average of 1.2:1 versus the 2:1 regulatory maximum provides cushion for mark-to-market volatility without breaching covenants or triggering technical defaults.
PE sponsor support: With 70-75% of borrowers being PE-sponsored, the sponsors have strong incentives to inject capital during periods of stress. They want to preserve their equity value and enable exits down the road.
PE dry powder: Private equity funds are sitting on roughly $2 trillion in uninvested capital that could be deployed for portfolio company support or even direct BDC recapitalization if needed.
Concentration risk: The flip side is that the top 10 BDCs control 51% of sector assets. BCRED at $80.3 billion and OCINCC at $34.8 billion dominate the perpetual segment. Scale brings real efficiencies—better deal access, lower unit costs—but it also means if one large manager hits serious trouble, it affects pricing and sentiment across the whole market.
The Broader Private Credit Picture
BDC debt represents just 0.9% of the investment-grade index for index-eligible tranches ($64.3 billion out of $241 billion total BDC debt). That’s a small footprint relative to any systemic importance—nothing remotely like the GSIB interconnectivity we saw during 2008.
But private debt doesn’t just live in BDCs. It sits across insurance company portfolios, pension funds, and sovereign wealth allocations. The asset class grew partly through regulatory arbitrage—revolving credit facilities receive favorable bank capital treatment, while unrated or BBB-rated private debt gets assigned low capital charges at insurance companies. This made growth attractive for all participants across the ecosystem.
Similar to life insurers, BDC managers earn fees based on AUM growth. That creates potential tension between accumulating assets quickly and maintaining credit discipline. When the incentive structure rewards deploying capital fast to capture management fees, underwriting standards can slip.
What to Watch
The 2021-2022 vintage—loans originated at peak leverage and valuations—will deliver its verdict over the next 2-3 years as these loans mature. Whether credit markets keep funding BDCs at current spreads depends on how three things play out: borrower leverage (sitting at 5.6x now), PIK levels (at 7.8%), and whether perpetual structures hold up when tested through full credit cycles (many remain untested).
BDCs exist at current scale because credit markets enabled it through $241 billion in leverage. That transformed $293 billion in equity into $534 billion in lending capacity. The 2018 regulatory change doubled the leverage multiplier from 1:1 to 2:1, unlocking 50% more origination power from the same equity base.
But the pressure we’re seeing doesn’t come from credit markets refusing to refinance BDC bonds. It comes from equity investors pulling back on perpetual BDCs, forcing redemptions, establishing lower marks through forced asset sales, triggering more redemptions. That’s the reflexivity loop that matters.
Asset coverage levels and structural protections make outright BDC failures pretty unlikely. The real question is what happens to dividend coverage, NAV stability, and equity valuations when PIK rises above sustainable levels, base rates keep falling, and software exit markets stay closed.
Worth tracking these metrics: (1) PIK exceeding 10% of total income at large issuers, (2) non-accruals breaking above 4-5%, (3) price-to-NAV discounts widening beyond 15%, (4) redemption requests at perpetual BDCs exceeding 10% quarterly, (5) software portfolio marks relative to where public software comps are trading.
Credit markets built the BDC sector. But it’s equity markets that will determine whether it keeps growing or starts contracting.
Listen to the full episode for John’s take on BDCs.
This article is based on Episode 7 of Fixed + Floating, featuring John Giordano of Seaport Global. The views expressed are those of the speakers and do not constitute investment advice. For more information on John’s research, please visit https://seaportglobal.com/capabilities/credit-research-coverage/.
Fixed + Floating is the premier podcast for institutional investors and finance professionals exploring the forces shaping global credit markets. Hosted by Portfolio Manager Josef Pschorn, the show features conversations with leading voices from investing, research, and academia. We analyze the technical mechanics of High Yield, Private Debt, and Distressed Situations—from covenant evolution and liability management to macro policy impacts on credit cycles—providing forensic depth for the global fixed-income community.
Support Material: