

Chemicals Overcapacity Crisis
E4: Why margins collapsed across the sector (ft. Tim Riminton, BI)

The chemicals sector has historically operated on predictable cycles—downturns followed by margin recovery as supply and demand rebalance. The current environment, however, represents something fundamentally different. Persistent sub-80% utilization rates and structural cost disadvantages suggest that high-cost European and North Asian assets (particularly naphtha-based crackers in South Korea, Japan, and Taiwan) are becoming permanently uneconomic.
The credit market has responded accordingly. European High Yield chemical spreads trade 600bps wider than the broader index, reflecting recognition that existing capital structures—modeled on historical mid-cycle margins—cannot survive the current feedstock and oversupply dynamics. Absent significant demand recovery or capacity rationalization, restructurings and plant closures appear inevitable.
In Episode 4 of Fixed and Floating, I spoke with Timothy Riminton, Senior Credit Analyst at Bloomberg Intelligence, about the forces driving this structural shift and its implications for credit investors across the capital structure.
The Material Drivers: Capacity, Demand, and Feedstock
The current imbalance is the result of several synchronized structural shifts:
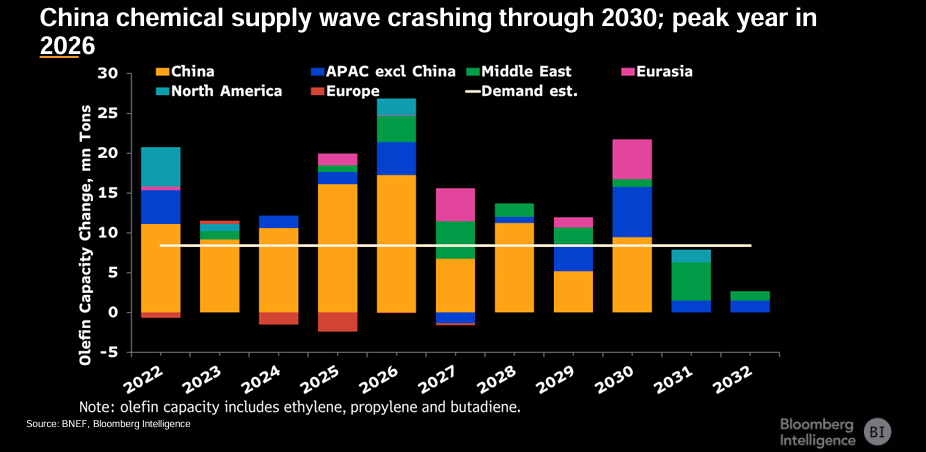
State-Directed Overcapacity: A massive investment wave, primarily in China and the Middle East, is projected to peak in 2026. China’s move toward 90% self-sufficiency in key olefins removes a critical pillar of global demand. This transition moves China from the world’s primary importer to a net competitor, permanently depressing global operating rates.
Stagnation of End-Market Sinks: The industry has lost its primary engine for growth. The exhaustion of the Chinese property model, combined with high interest rates weighing on Western construction and automotive sectors, has eliminated the demand buffer needed to absorb new global capacity.
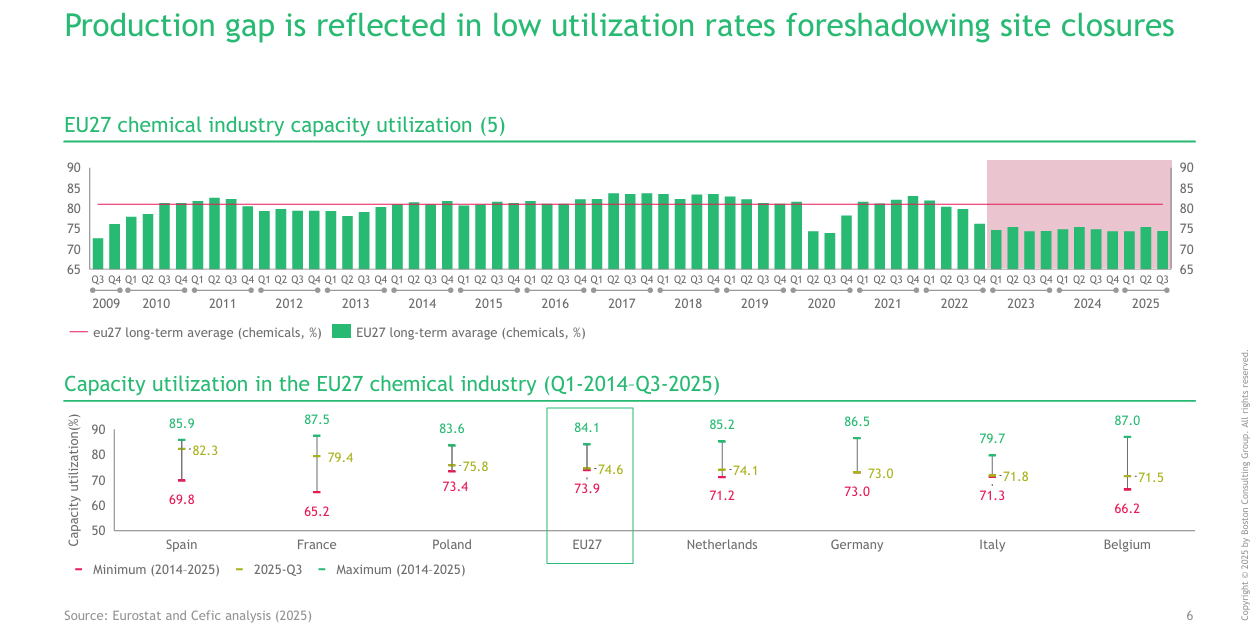
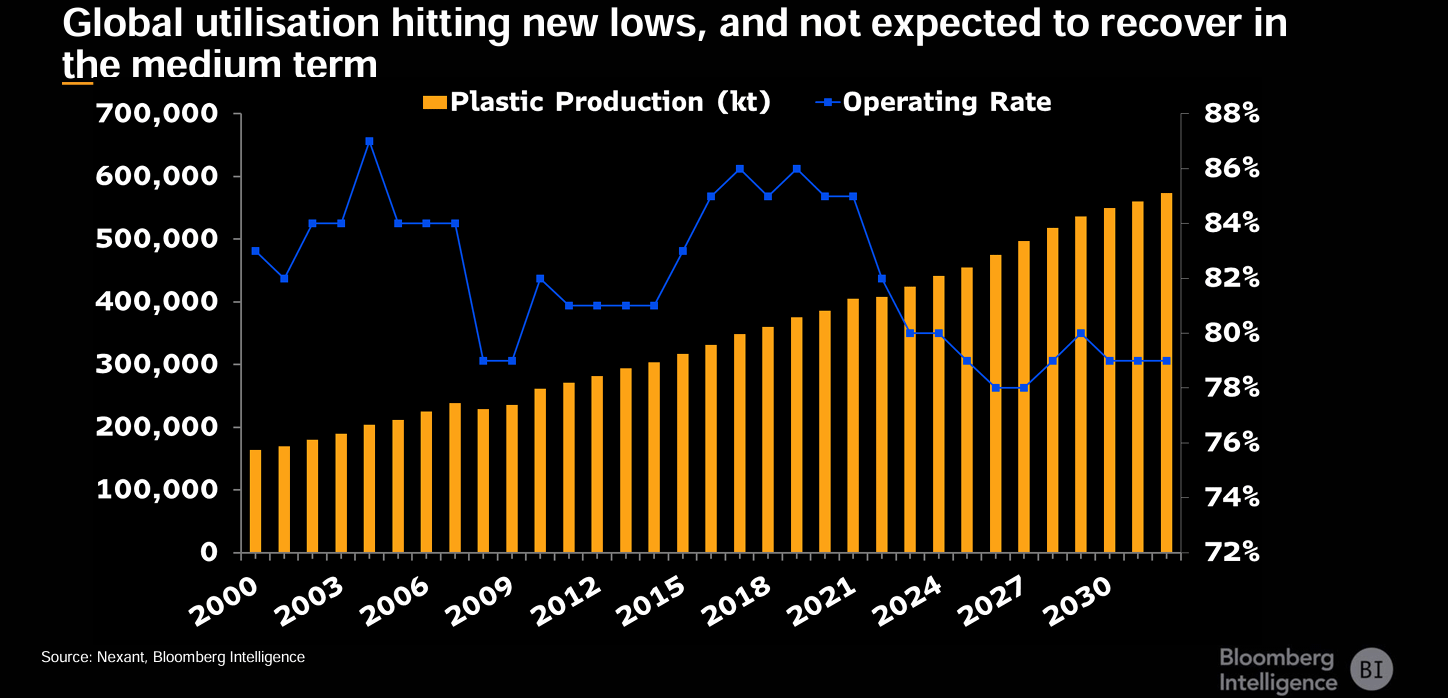
The Fixed-Cost Absorption Crisis: Global utilization has fallen to levels that challenge the unit economics of integrated sites. In Europe, operating rates have hit 69.8%. In a capital-intensive industry, running significantly below 80% utilization prevents the absorption of fixed costs, causing cash flow to turn negative after debt service even for historically efficient operators.
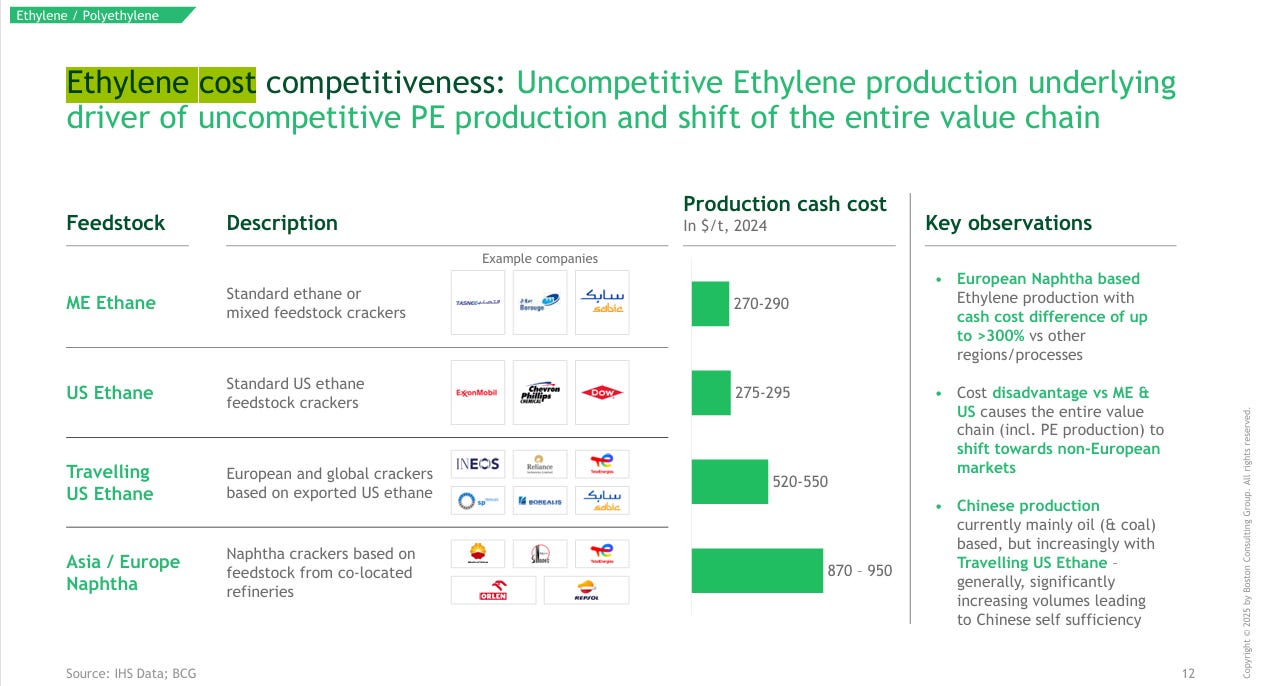
The Structural Feedstock Gap: The industry is bifurcating based on raw material costs. Ethane-based production in the US maintains a cash cost of approximately $280/t. Conversely, European and North Asian naphtha-based production costs exceed $950/t. This 300% delta is a physical cost barrier that cannot be mitigated by operational efficiency; it dictates a permanent migration of production toward low-cost feedstock hubs.
Understanding the Chemical Value Chain
To grasp the severity of current conditions, it helps to understand what chemicals actually are and how they’re produced. The industry produces approximately 450 million tons of polymers (plastics) annually, consuming 5-6% of global oil production—a share that has been gradually rising for decades.
The transformation from crude oil to plastic fork follows a relatively straightforward path: crude oil goes to refineries, which distill it into various products including naphtha, a mid-distillate. This naphtha feeds into steam crackers—massive facilities that heat hydrocarbons to extreme temperatures and pressures in the presence of catalysts, breaking molecular bonds and rearranging them into ethylene and propylene.
These olefins—ethylene in particular—form the backbone of virtually the entire chemical value chain. Ethylene is then polymerized into solid plastic pellets of polyethylene, which are shipped to converters who melt and shape them into finished products.
This value chain serves enormous end markets: construction consumes 20-25% of chemical production, automotive takes 12-15%, and packaging represents roughly 20%. These are all GDP-sensitive, financing-dependent sectors—which becomes crucial when understanding the demand side of today’s crisis.
The Scale of Growth—and Now Contraction
The chemicals industry experienced nearly uninterrupted expansion for a quarter century. Global plastics production grew approximately 180% from 2000 to 2025, with only a slight dip during the 2008 financial crisis. This growth reflected rising middle classes, increasing substitution of plastics for metal and glass in packaging, and greater use of polymers across electronics, home furnishings, fabrics, and construction.
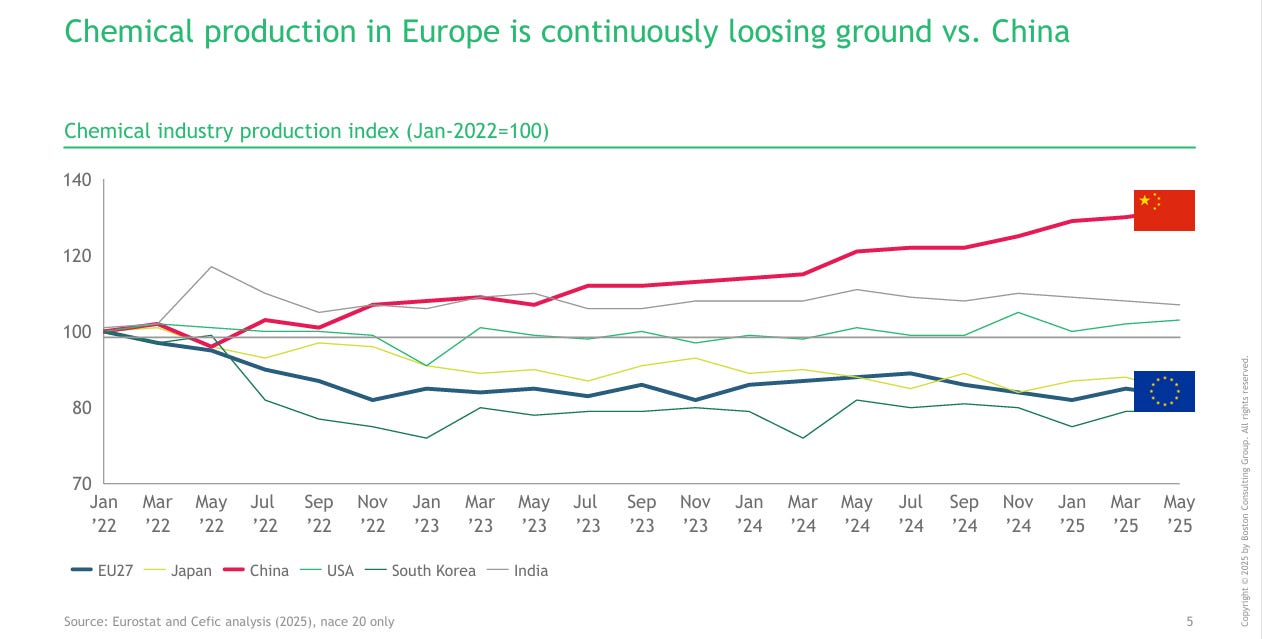
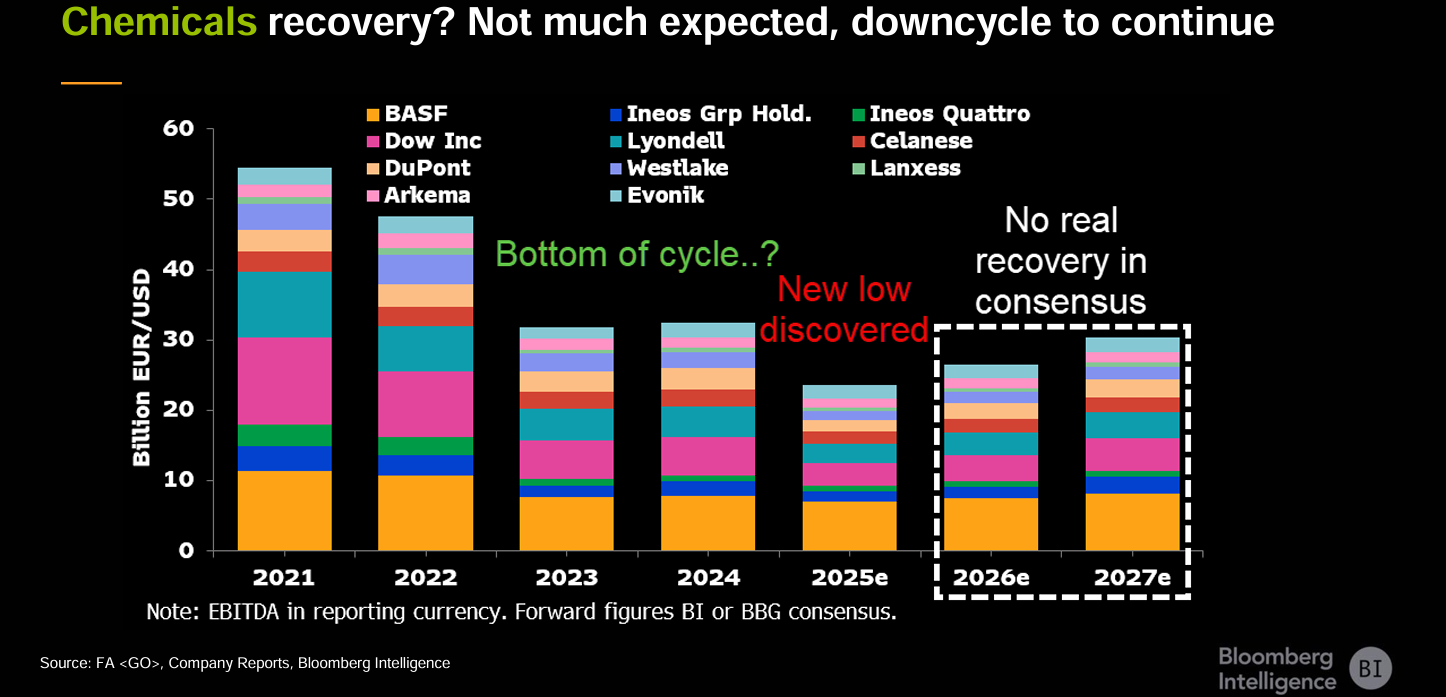
But that era of consistent GDP-plus growth has ended. European production has declined precipitously relative to China and other regions, reflecting not temporary weakness but permanent competitive displacement. Notably, Asian producers in Japan and South Korea have been equally hard hit—their production indices show similar declines as China's self-sufficiency drive eliminates their primary export market. The downcycle has now persisted for three years, and market consensus doesn't expect recovery before 2028 at the earliest.
The Geography of Production: Three Regions, Three Trajectories
The global chemicals industry can be usefully divided into three producing regions, each with distinct characteristics and trajectories:
Europe: The Legacy Producer
Europe is the birthplace of the modern chemicals industry, home to BASF in Germany, the world’s largest chemical company. Much of Europe’s asset base dates from the 1960s-1980s. Until recently, no new major cracker had been built in Europe for nearly three decades - INEOS new facility in Antwerp represents the first in that period.
Europe has historically been an exporting region despite higher costs, sustained by sophisticated specialty chemicals and integrated production complexes that hadn’t been replicated elsewhere. But the combination of structural cost disadvantages, the energy crisis post-Ukraine invasion, and three years of margin compression has triggered permanent closures. Approximately 20% of European cracking capacity is shutting or will shut in coming years.
The United States: The Shale Revolution
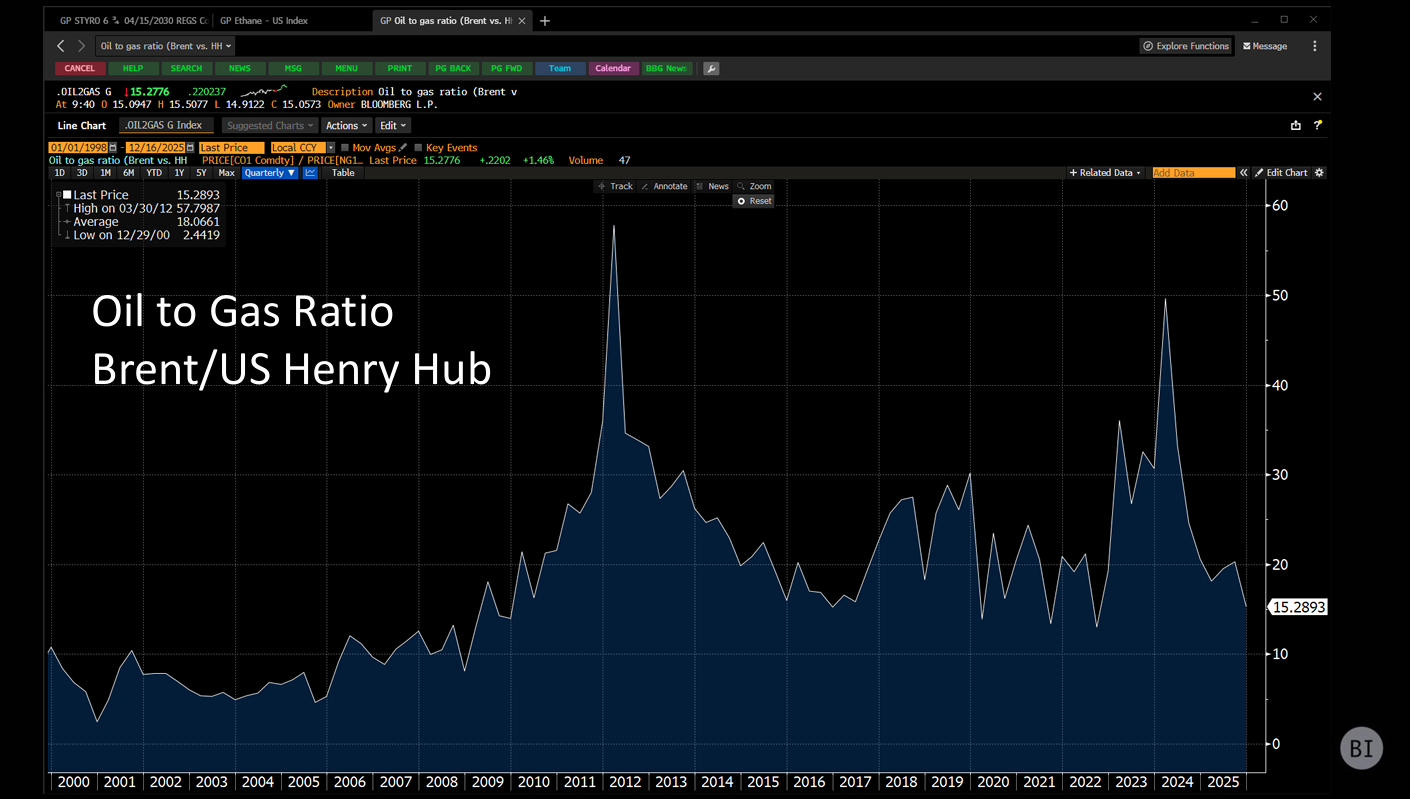
The US chemical landscape was transformed by the shale boom starting around 2012-2013. Historically, like Europe, US crackers used naphtha from oil. But abundant shale gas, particularly ethane-rich gas, changed the economics fundamentally.
The Brent-to-Henry Hub oil-to-gas price ratio widened dramatically post-shale, making gas-based production far more economical than oil-based routes. This prompted massive investment in new US cracking capacity. Today, alongside the Middle East, the US represents the world’s most cost-advantaged production region.
The US exports roughly one-third of its chemical production—a significant export dependence that means even cost-advantaged US producers suffer when global markets are oversupplied.
Asia-Pacific: China’s Self-Sufficiency Drive
China consumes approximately half of global chemical production but historically produced only about 40%, making it the world’s largest importer. The massive capacity build-out underway represents China’s push toward self-sufficiency—and this is the core of the global crisis.
As China expands capacity, it reduces imports, creating surpluses for other APAC producers like South Korea, Japan, and Taiwan that previously exported significant volumes to China. These producers no longer have their primary market, and margins in Asia are currently the worst among major regions globally.
Deep Dive: State-Directed Overcapacity
A massive investment wave, primarily in China and the Middle East, is projected to peak in 2026. This isn't organic market development—it's state-directed industrial policy creating permanent structural change. China's move toward self-sufficiency in key olefins removes a critical pillar of global demand, transforming China from the world's primary importer to a net competitor.
China's latest five-year plan emphasizes "quality over quantity," language that initially sparked hope in Western boardrooms that Beijing might rationalize older, inefficient capacity. Closer examination suggests otherwise: while some older plants may close, many are slated for upgrades to produce specialty chemicals rather than permanent retirement. China has already achieved self-sufficiency in many bulk commodities it previously imported; the logical next step is expanding into specialty chemicals—products with patent protection in some cases but many without, sold in markets with limited competition and therefore better pricing power. This represents a direct threat to the precise market segments that have supported Western producers' earnings. Specialty chemicals initially weathered the downturn better than commodities during 2022-2023, but from 2024 into 2025, that resilience faded. Producers like Celanese, manufacturing high-tech engineering materials largely from the nylon value chain, now face more direct competition as customers trade down to cheaper, lower-performance polymers given oversupply.
Middle Eastern producers, led by Saudi Aramco, are simultaneously expanding petrochemicals as part of a long-term strategy to offset declining fuel demand from EVs and alternative aviation fuels. They export more than 70% of chemical output, positioning themselves as permanent marginal exporters with structural cost advantages based on abundant, cheap ethane feedstock.
Operating Leverage: Why Small Revenue Drops Destroy Profitability
The result of this capacity wave: global operating rates have collapsed. For years, the industry operated at low-to-mid 80% utilization. Since 2021, operating rates have fallen into the high 70s—and projections suggest recovery to 80% may not occur until the early next decade.
A 4-6 percentage point decline in utilization may sound modest, but in a commodity business with massive operational leverage, it’s devastating. Chemical producers operate with feedstock costs around 80% of total costs and fixed costs around 10%, leaving margins of approximately 10%. When product prices fall while feedstock costs remain stable, nearly the entire adjustment hits the margin. Whether running at 60% or 100% utilization, producers need roughly the same headcount and overhead, with only modest energy cost variation.
Consider a simplified example: a producer generating €1,000m revenue might earn €150m EBITDA (15% margin). If revenue drops 20% to €800m due to lower volumes and prices, but feedstock costs (€800m → €640m) and fixed costs (€100m unchanged) move proportionally on volume but not on price compression, EBITDA can collapse to €60m—a 60% decline. In severe scenarios where price compression is steeper, that same €800m revenue could generate near-zero profitability as the margin gets entirely compressed.
INEOS Quattro saw EBITDA collapse 60% quarter-on-quarter from Q2 2022 to Q3 2022, demonstrating the extreme cyclicality embedded in this sector’s operating model when demand shocks hit.
This creates a prisoner’s dilemma. Chemical assets can be ramped up or down within days, unlike industries such as steel where blast furnaces cannot run much below 80% utilization without mothballing. This flexibility means every producer has powerful incentives to run plants hard to spread fixed costs over more volume, but when all producers do this simultaneously in a weak market, it keeps supply elevated and drives margins lower. Chemical companies are reluctant to close facilities because idle assets earn nothing, and shutting permanently risks losing customers. In Europe, permanent closure is especially costly due to labor obligations and site remediation requirements. The result is chronic oversupply where no one wants to be first to exit, even as collective behavior destroys profitability.
Demand Destruction Across End Markets
The industry has lost its primary growth engine. Chinese polyethylene demand growth averaged 3 million tons annually in the five years before 2021. Since 2021, that collapsed to just 800,000 tons per year—a massive slowdown triggered by the end of China’s construction and property boom.
Simultaneously, Western construction and automotive sectors remain depressed by elevated interest rates (only recently declining) and the lingering effects of inflation on consumer purchasing power. The industry built capacity assuming continued strong demand that simply hasn’t materialized.
The state of demand reflects multiple headwinds:
Post-COVID Demand Normalization: Some analysts argue COVID pulled forward several years of durable goods demand—people working from home bought TVs, washing machines, furniture earlier than planned, reducing subsequent replacement demand.
Construction Sector Weakness: Higher interest rates globally suppressed construction activity, a sector representing 20-25% of chemical demand. While rates have now declined, the lag between rate cuts and actual construction starts remains substantial. Leading indicators like housing permits have improved in Germany and France, but translation to actual construction may not materialize until late 2026 or beyond.
Consumer Purchasing Power: Cumulative inflation since 2020 has eroded real wages, particularly for middle- and lower-income consumers who drive volume consumption. The widely discussed “K-shaped recovery” compounds this: spending by high earners cannot offset weakness among the bottom two-thirds of the population, and chemicals are volume businesses.
The Structural Feedstock Gap: A 300% Cost Differential
The industry is bifurcating based on raw material costs, and this gap cannot be closed through operational efficiency. Consider the cash cost structures for ethylene production:
US ethane-based production: ~$280/t
Middle East ethane-based: ~$270-290/t
European naphtha-based: ~$870-950/t
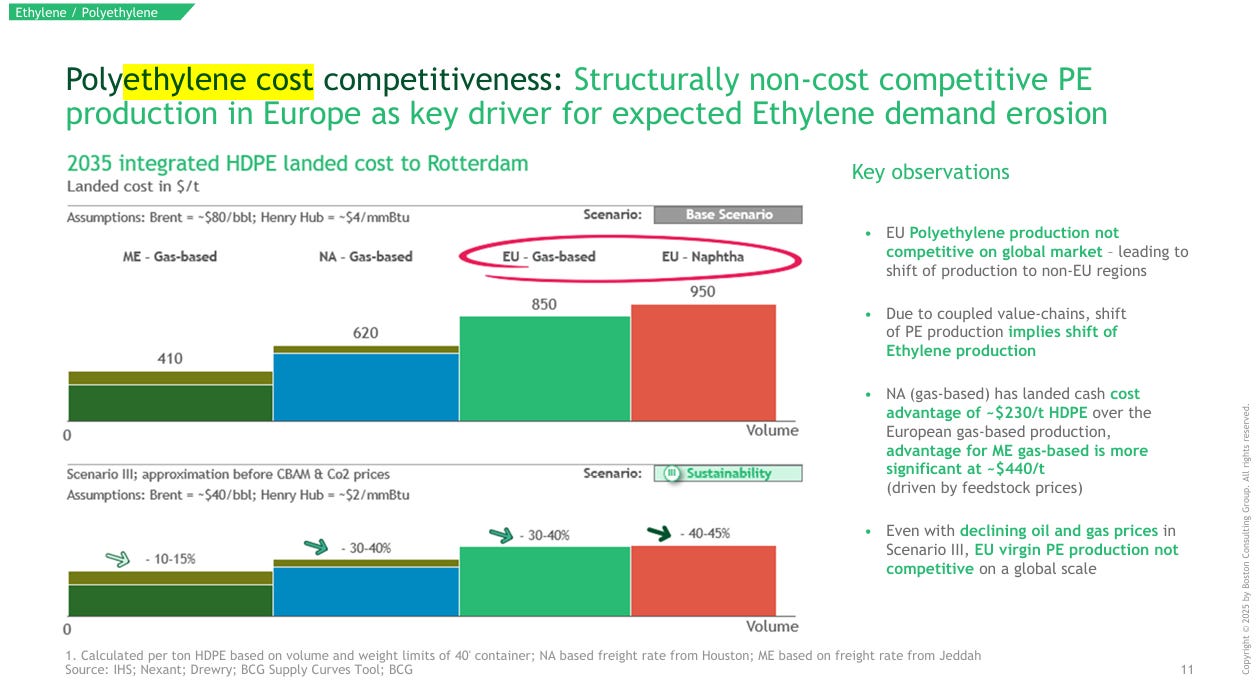
This represents a 240% cash cost disadvantage for Europe (950/280 = 3.39x). Even after adding $50-100/t freight to ship US product to Rotterdam, the US landed cost advantage remains ~$200-400/t versus local European production. This hierarchy cannot be bridged by efficiency gains alone. European and North Asian naphtha-based production occupies the far right of the global cost curve—a position that becomes untenable in an oversupplied market. Even with declining oil and gas prices, European virgin polyethylene production cannot compete globally.
This feedstock disadvantage drives the entire integrated value chain—from ethylene to polyethylene—to migrate toward low-cost regions. European demand pools are shrinking as downstream polyethylene production becomes uneconomic, further reducing the rationale for maintaining European cracking capacity.
The US landed cost advantage of approximately $230/t over European production, and the Middle East advantage of ~$440/t, includes freight. This means Middle Eastern and US producers can ship product to Europe at lower total cost than European producers manufacturing domestically—a fundamentally unsustainable competitive position.
Who Closes First? The Paradox of Large-Scale Shutdowns
Conventional wisdom suggests smaller, financially weaker players should fail first while larger, diversified producers ride out the cycle. European reality has inverted this expectation.
Many closure announcements have come from major producers like Dow and Shell. Why? A small player with two or three assets faces an existential decision when closing one facility—it eliminates a core earnings stream. Large, globally diversified producers can afford to mothball loss-making European assets, take restructuring provisions, and potentially improve group EBITDA by avoiding ongoing losses and deferred maintenance capex.
Dow, for example, mothballed a relatively newer European cracker partly to avoid a large upcoming turnaround capex bill potentially in the tens of millions. The facility was generating losses; paying substantial maintenance capital would compound the problem.
This creates a perverse dynamic: smaller high-yield issuers are effectively hanging on, hoping larger players rationalize capacity first. Many are simply trying to survive until demand recovers - the familiar “kicking the can” strategy that defines much of high yield during distress.
The European Dimension: Energy, Policy, and Competitive Pressure
Europe faces a unique convergence of challenges beyond pure feedstock economics. The post-Ukraine energy crisis pushed European gas and power prices structurally higher than global benchmarks. While prices have normalized from crisis peaks, the gap versus the US, Middle East, and China persists. After three years of downcycle with no clear recovery, this differential is driving permanent closure decisions rather than temporary shutdowns.
Global overcapacity translates into import pressure. The European Commission found successful anti-dumping cases in PVC, where US and Middle Eastern producers sold into Europe below domestic prices. Beyond formal dumping, China’s governance structure incentivizes maintaining production even when uneconomic—local authorities face growth targets and avoid closures that increase unemployment. New Chinese plants run at very high utilization to satisfy financing covenants despite poor margins, creating what Western producers call “unfair competition.”
The European carbon policy framework adds cost pressure through the phased elimination of free ETS allocations through 2034. Heavy emitters currently receive nearly all certificates free but will need to purchase them at historically volatile prices. This creates planning challenges for long-term capital investment in an industry already facing structural headwinds.
My Take: The Specialty Threat Markets Miss
Credit markets are still treating the chemicals crisis as a sector-specific story rather than the latest iteration of a playbook already visible in solar, batteries, EVs, and automation. China’s industrial policy is explicit: chemicals sit alongside aerospace, electronics, and batteries within “Made in China 2025” and the 14th Five-Year Plan, with the goal of achieving self-sufficiency in critical materials and moving systematically into higher-value segments. The result is not a marginal competitive nuisance but the deliberate construction of a parallel ecosystem that can run at structurally lower financial returns for much longer than Western capital structures can tolerate.
The core problem is not technical capability but return-on-capital asymmetry. Western specialty producers need mid-teens ROIC to sustain leverage and keep equity viable; Chinese state-backed enterprises can accept single-digit returns for a decade if it delivers employment, technological catch-up, and geopolitical resilience. That gap compounds over time. It is already visible in agrochemicals, where Bayer’s closure of its Frankfurt crop protection facility and pivot away from “innovation-led” products signals that what used to be a margin-accretive, European-strength segment is now subject to the same displacement dynamics as commoditized intermediates. China now files more PCT patents than anyone else, with chemistry a meaningful share, though quality metrics (citations, triadic filings) show US/EU/Japan still dominating high-impact IP like coatings—while China’s surge emphasizes volume over depth. Chemicals is a mature, slow‑innovation field (~2,000 new molecules/year), making catch‑up feasible via proximity to China’s booming autos/electronics/renewables and coal‑derived advantages like polysilicon. China exports most basics (e.g., polypropylene overcapacity) but runs a specialty deficit—now flipping as MIIT targets those higher margins. The real question: how “special” are specialties, and how protected are they really against scale and policy push—like Bayer’s Frankfurt ag chem closure?
Policy protection cannot bridge this structural divide. European tariffs and anti-dumping measures will likely intensify, but even meaningful intervention cannot erase 300% structural differentials in feedstock and energy costs. US/ME/Chinese-sourced inputs remain cheaper, which forces production migration regardless of political intent: multinationals source from the lowest-cost base for non-EU volumes, European plants lose scale, and fixed-cost absorption collapses. As local production becomes uneconomic, Europe simultaneously cedes domestic share to imports and loses export competitiveness to lower-cost regions. A similar pattern is emerging in East Asia as China moves toward self-sufficiency and gradually displaces Japanese, Korean, and Taiwanese producers from its import mix.
For credit investors, this points to a restructuring wave rather than a gentle glide path. Smaller high-yield issuers with two or three facilities do not have the luxury of “rationalizing capacity” in the abstract—closing one asset can effectively destroy the operating model that underpins the capital structure. Capital structures built on historical utilization, specialty margins, and partial commodity cyclicality become unsustainable once volumes step down and pricing power erodes. Over the next 24–36 months, that mismatch is likely to surface in more restructuring activity.
Strategic M&A offers both a pressure valve and a price signal. The CABB–Anupam Rasayan transaction—CABB selling its US-based Jayhawk Fine Chemicals site to a lower-cost Indian specialty player for roughly $150 million—illustrates how asset values can remain meaningful even as enterprise values for overlevered Western issuers compress. High-cost producers shed assets they can no longer run competitively; lower-cost or better-integrated buyers step in, often closer to end-markets or with backward-integrated feedstocks. Variations of this template—asset divestitures, carve-outs, cross-border joint ventures, and capacity swaps—are likely to proliferate as traditional refinancing becomes harder to access.
The open question is whether demand recovery can rescue these capital structures in time. Construction and automotive volumes should eventually benefit from fiscal support and lower financing costs (in whatever form), but the location of that recovery matters as much as its magnitude. If incremental demand is served primarily by the US and Middle East on the feedstock side and by China and India on the downstream side, European and East Asian incumbents will see less of the upside than their historical share would suggest—and, critically, a large portion of their historical export share now looks permanently lost for both European and Japanese/Korean producers. Meanwhile, planned capacity additions through 2030—and China’s continued march into specialties—mean that even a cyclical rebound may occur against a backdrop of persistent overcapacity and structurally lower margins.
All of this adds up to a permanent geographic and economic rebalancing of the industry. Europe is already in the midst of closing material capacity—once large complexes shut, remediation and labor costs make reopening implausible—and will likely retreat further from bulk commodities toward narrower specialty niches that rely on complex integration, regulatory expertise, or proximity to demanding customers. The US and Middle East will deepen their role as low-cost production hubs. China will move from net importer to self-sufficient producer and, increasingly, net exporter in both commodity and specialty segments, compressing the “defensive” earnings cushion that underwrote much of the sector’s leverage.
The key findings for credit are straightforward and uncomfortable. First, the chemicals crisis is not a cyclical air pocket but a structural reset driven by state-directed overcapacity, entrenched feedstock differentials, and shifting demand geography. Second, the assumption that specialties can indefinitely subsidize leveraged balance sheets as commodities struggle is breaking down as Chinese competition climbs the value chain and as case studies like agrochemicals reveal how quickly margin pools can be hollowed out. Third, capital structures designed for historical return profiles will need fundamental resizing—through asset sales, liability management, or outright restructurings—to align with permanently lower earnings potential.
This is not a normal downcycle that can be endured with modest capacity cuts and patient capital. The scale of overcapacity, the permanence of the cost disadvantage, and the structural nature of the demand shift suggest the industry will look fundamentally different by the end of this decade, and credit investors who underwrite chemicals as if it were still a mean-reverting sector risk discovering that the mean itself has moved.
Listen to the full episode for Tim’s take on the current upheaval in the chemicals industry.
This article is based on Episode 4 of Fixed + Floating, featuring Timothy Riminton of Bloomberg Intelligence. The views expressed are those of the speakers and do not constitute investment advice. For more information on Tim’s research, Bloomberg Intelligence clients can reach him via IB (Timothy Riminton BIO on the Bloomberg Terminal).
Fixed + Floating is the premier podcast for institutional investors and finance professionals exploring the forces shaping global credit markets. Hosted by Portfolio Manager Josef Pschorn, the show features conversations with leading voices from investing, research, and academia. We analyze the technical mechanics of High Yield, Private Debt, and Distressed Situations—from covenant evolution and liability management to macro policy impacts on credit cycles—providing forensic depth for the global fixed-income community.
Support Material: