


US high yield spreads are close to their tights. CCCs have lagged far behind. Yet Marty Fridson’s fair value model still had the market as a whole somewhat cheap at the end of October.
Thanks for reading! Subscribe for free to receive new posts and support my work.
Marty Fridson started as a corporate bond trader in 1976 and went on to head research groups at Morgan Stanley and Merrill Lynch. Since then he has made a habit of testing what the high yield market takes for granted. He is now Chief Investment Officer of Lehmann Livian Fridson Advisors. His starting point is that the spread is a risk premium, so it is cheap or rich only against the risk it prices.
“It’s wrong to say that the market is cheap simply because the spread is wider than its historical average,” Marty Fridson (Lehmann Livian Fridson Advisors).
This episode of Fixed + Floating was recorded on 2 November 2026. We discuss the market’s history, the changing index, Fridson’s fair value model and the CCC selloff. Then distressed debt, his undervalued-bond screen, private credit and AI issuance.
THE HISTORY THAT WAS WRONG
Much of what has been written about the early market is wrong, Fridson says. The first myth is that it consisted entirely of so-called “fallen angels”: bonds rated BBB or higher at issue and later downgraded. Supposedly nothing rated below BBB came to market until Michael Milken and Drexel Burnham Lambert started issuing it. Drexel was not the first firm to do that, Fridson said, and a small number of new issues came each year during the 1970s.
Milken himself “seemed to be interested mainly in refinancing distressed companies,” Fridson said. Financing LBOs was the idea of Leon Black, then in Drexel’s investment banking department.
The second myth “really verges into propaganda,” in his words. It held that Drexel was “democratizing capital” for companies shut out of the market. When Fridson studied those companies, he found they had raised money in the private placement market before they issued high yield bonds. “So they were not denied access to capital.” The attraction was that the early deals carried no meaningful covenants. That was “not as good a deal for the investors as the investors found out.”
Even the term high yield predates Drexel. John Moody was using it at least as early as 1919, Fridson said.
MARKET LORE, TESTED
The fallen angel story came with a trade attached. A downgrade forces institutional holders to sell, the bonds become undervalued in the fire sale, and buyers earn consistently superior returns when they recover. Fridson calls it one of “a number of things made up by traders or salesmen to get trades done.”
“That was a myth,” he said. He found no unusual risk-adjusted return on fallen angels. Some deteriorated until they defaulted, some rebounded and some returned to investment grade.
Forced selling was not even the policy. Fridson called the three largest pension plan sponsors in the United States and asked what their actual policy was. “The last thing we would want them to do would be to sell it immediately when everyone else is trying to sell it,” they told him. Managers had to discard the bond, but could take their time.
“There was no empirical support for any of those things,” Fridson said of the lore he tested.
Another piece of lore held that a dividend cut is good for bondholders because it frees cash for interest. CEOs are often large shareholders and delay the cut. When they finally make it, the market reads it as a sign of strain. “The bonds actually traded down.”
NOT THE SAME INDEX
The index that produced the long-run average is not today’s index. Fallen angels, once most of the market, were about 4% of it when we recorded.
The ICE BofA US High Yield Index was not digitised until 1996. In January 1997, bonds rated CCC & lower were 16% of its face amount. When we recorded, they were just under 10%. Secured bonds were 12.5% of face amount in 1997, much of it utility debt. When we recorded, they were 36%.
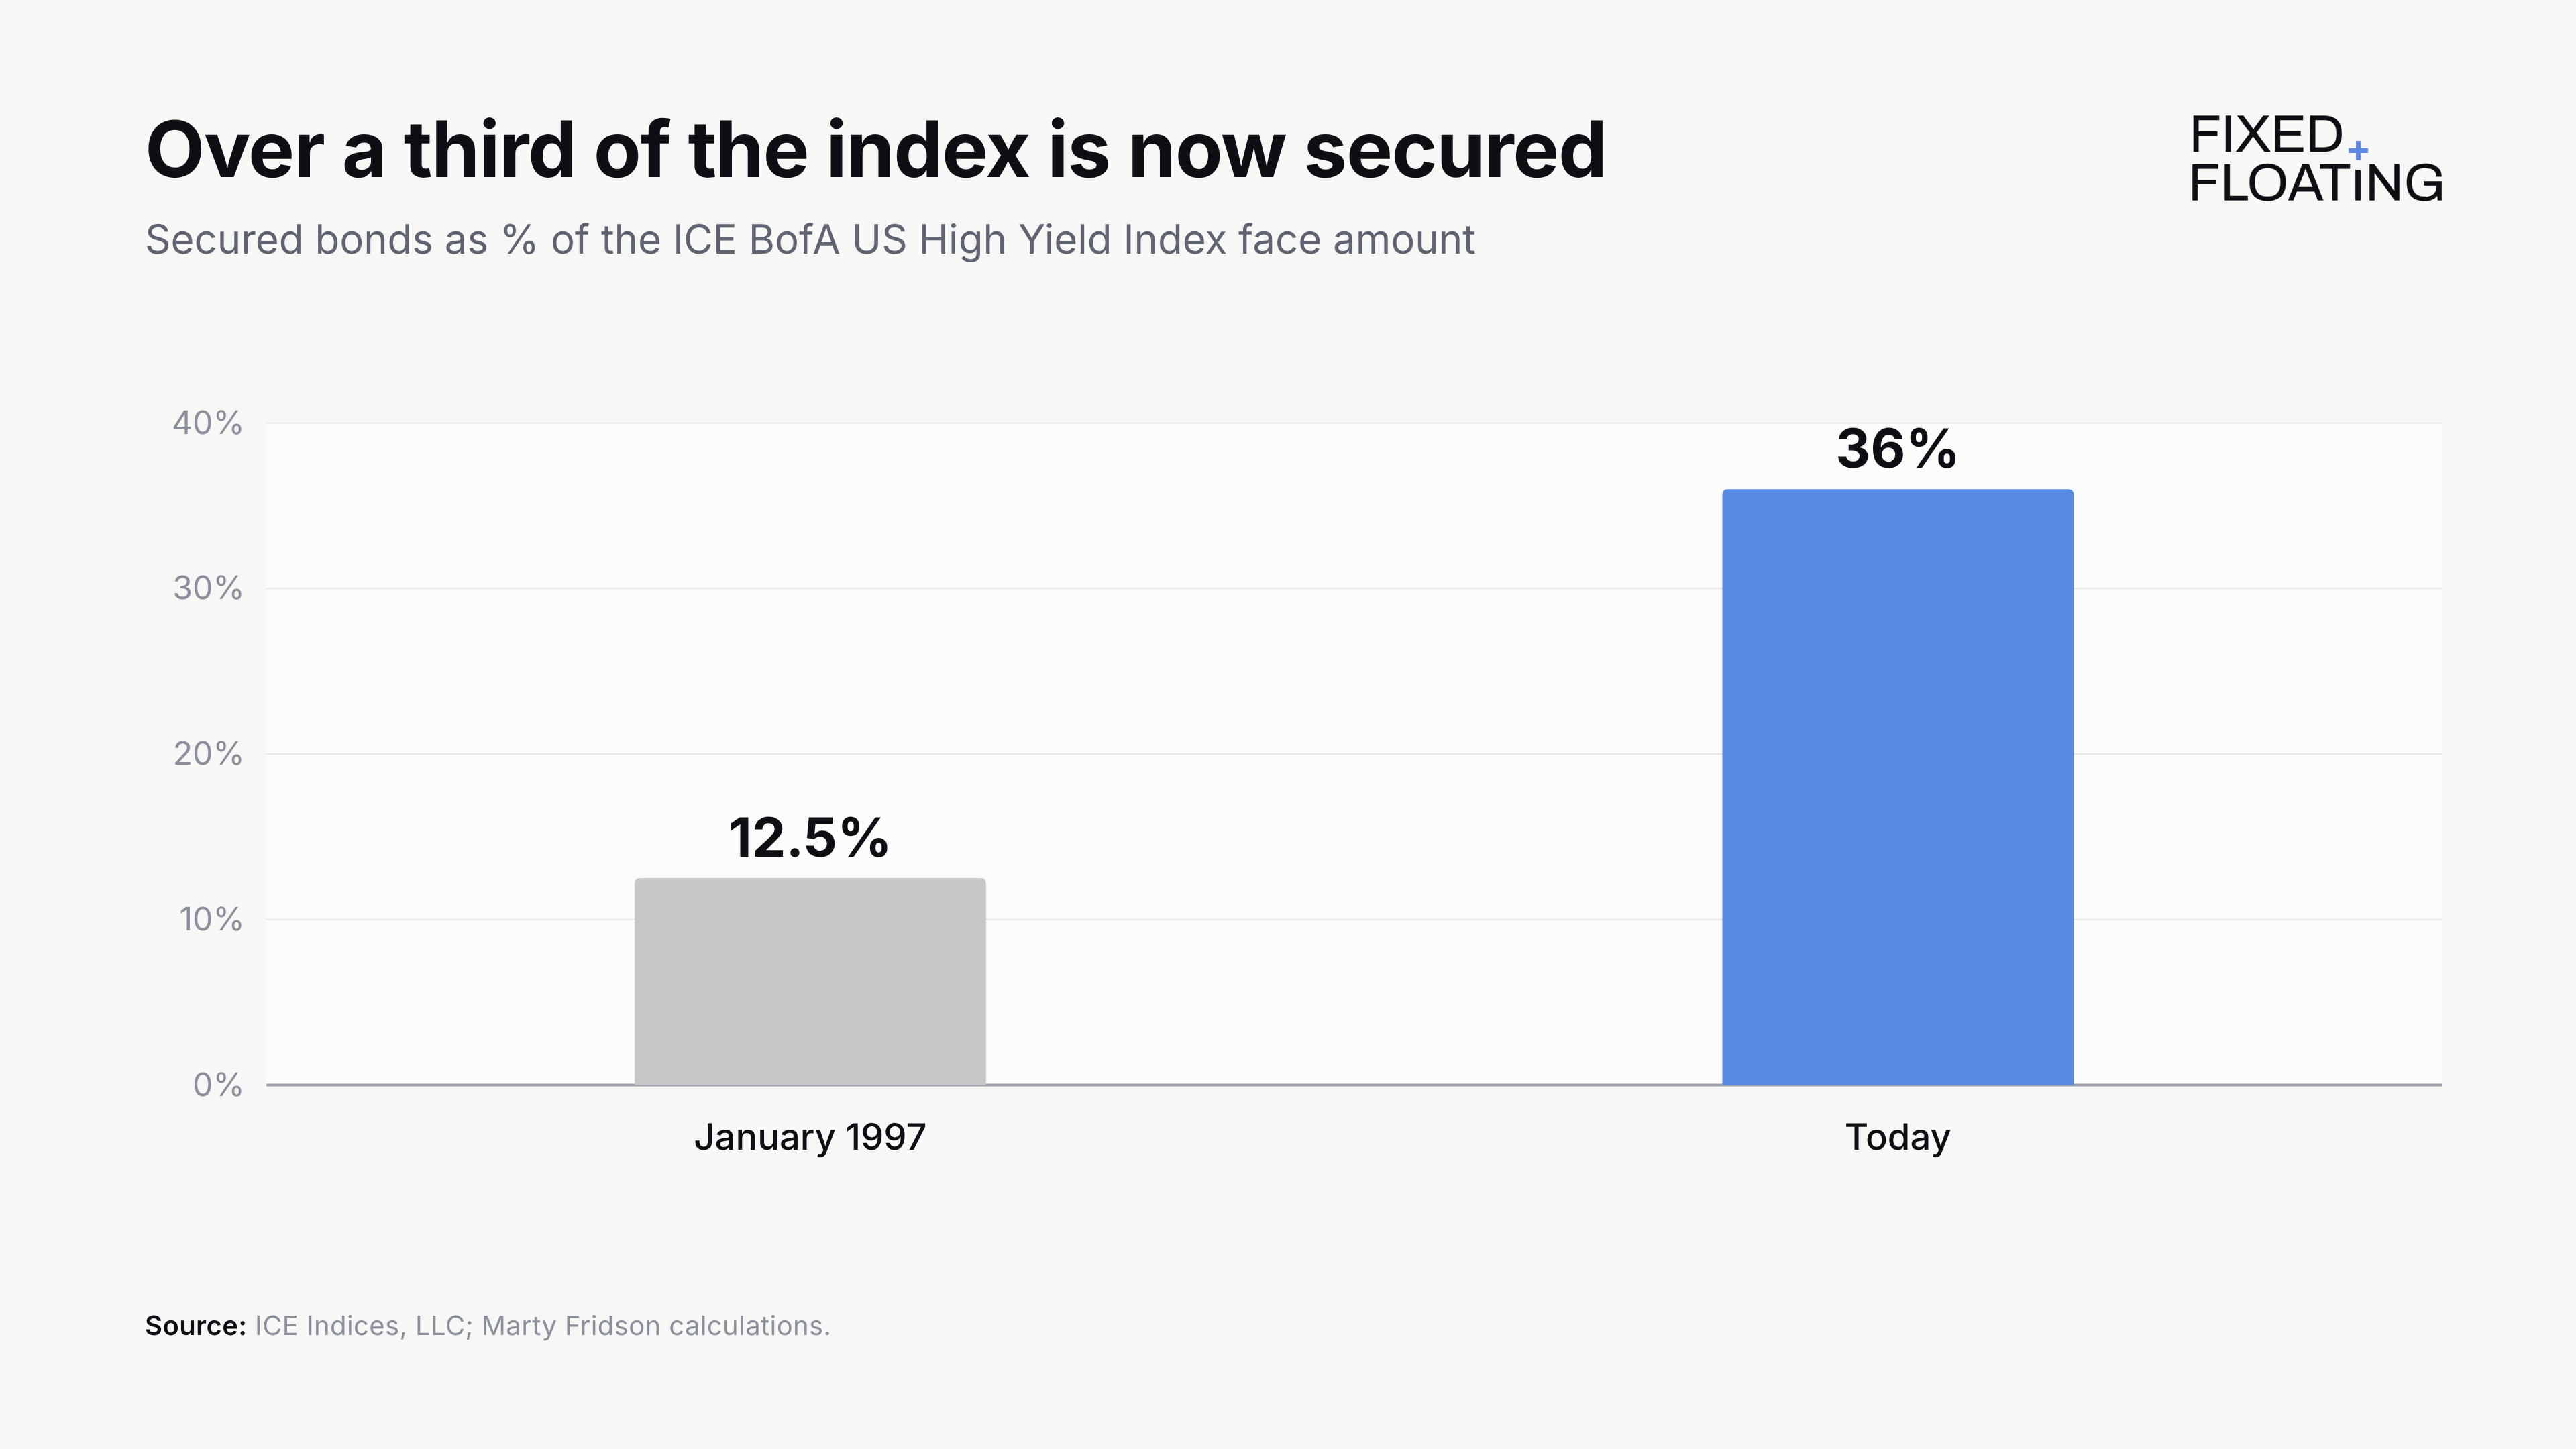
The share grew over time, with “a very significant shift over just the last 10 years,” Fridson said. He attributes some of it to competition for financing from the leveraged loan market and, more recently, private credit, where secured debt is typical. Bondholders want to be sure they will not be junior to new debt. “Particularly in private credit, a lot of that business is done specifically by finding loopholes in existing covenants,” he said. The loopholes let companies prime existing bondholders, the liability management exercises I raised next.
One result is that “secured” no longer tells a bondholder where it ranks. “There are actually some examples of four different levels of secured bonds,” Fridson said.
A WIDE SPREAD IS NOT A CHEAP SPREAD
More secured debt, fewer CCCs and more BBs lower the risk of the index as a whole, Fridson said. For the long-run average, that “definitely creates a problem.”
He makes a second point that holds even without the change in mix. “The spread is a risk premium,” he said. If the risk in financial markets is greater than average, “the spread should be greater than average.” A wide spread does not show that the market is cheap. You have to quantify the prevailing risk first.
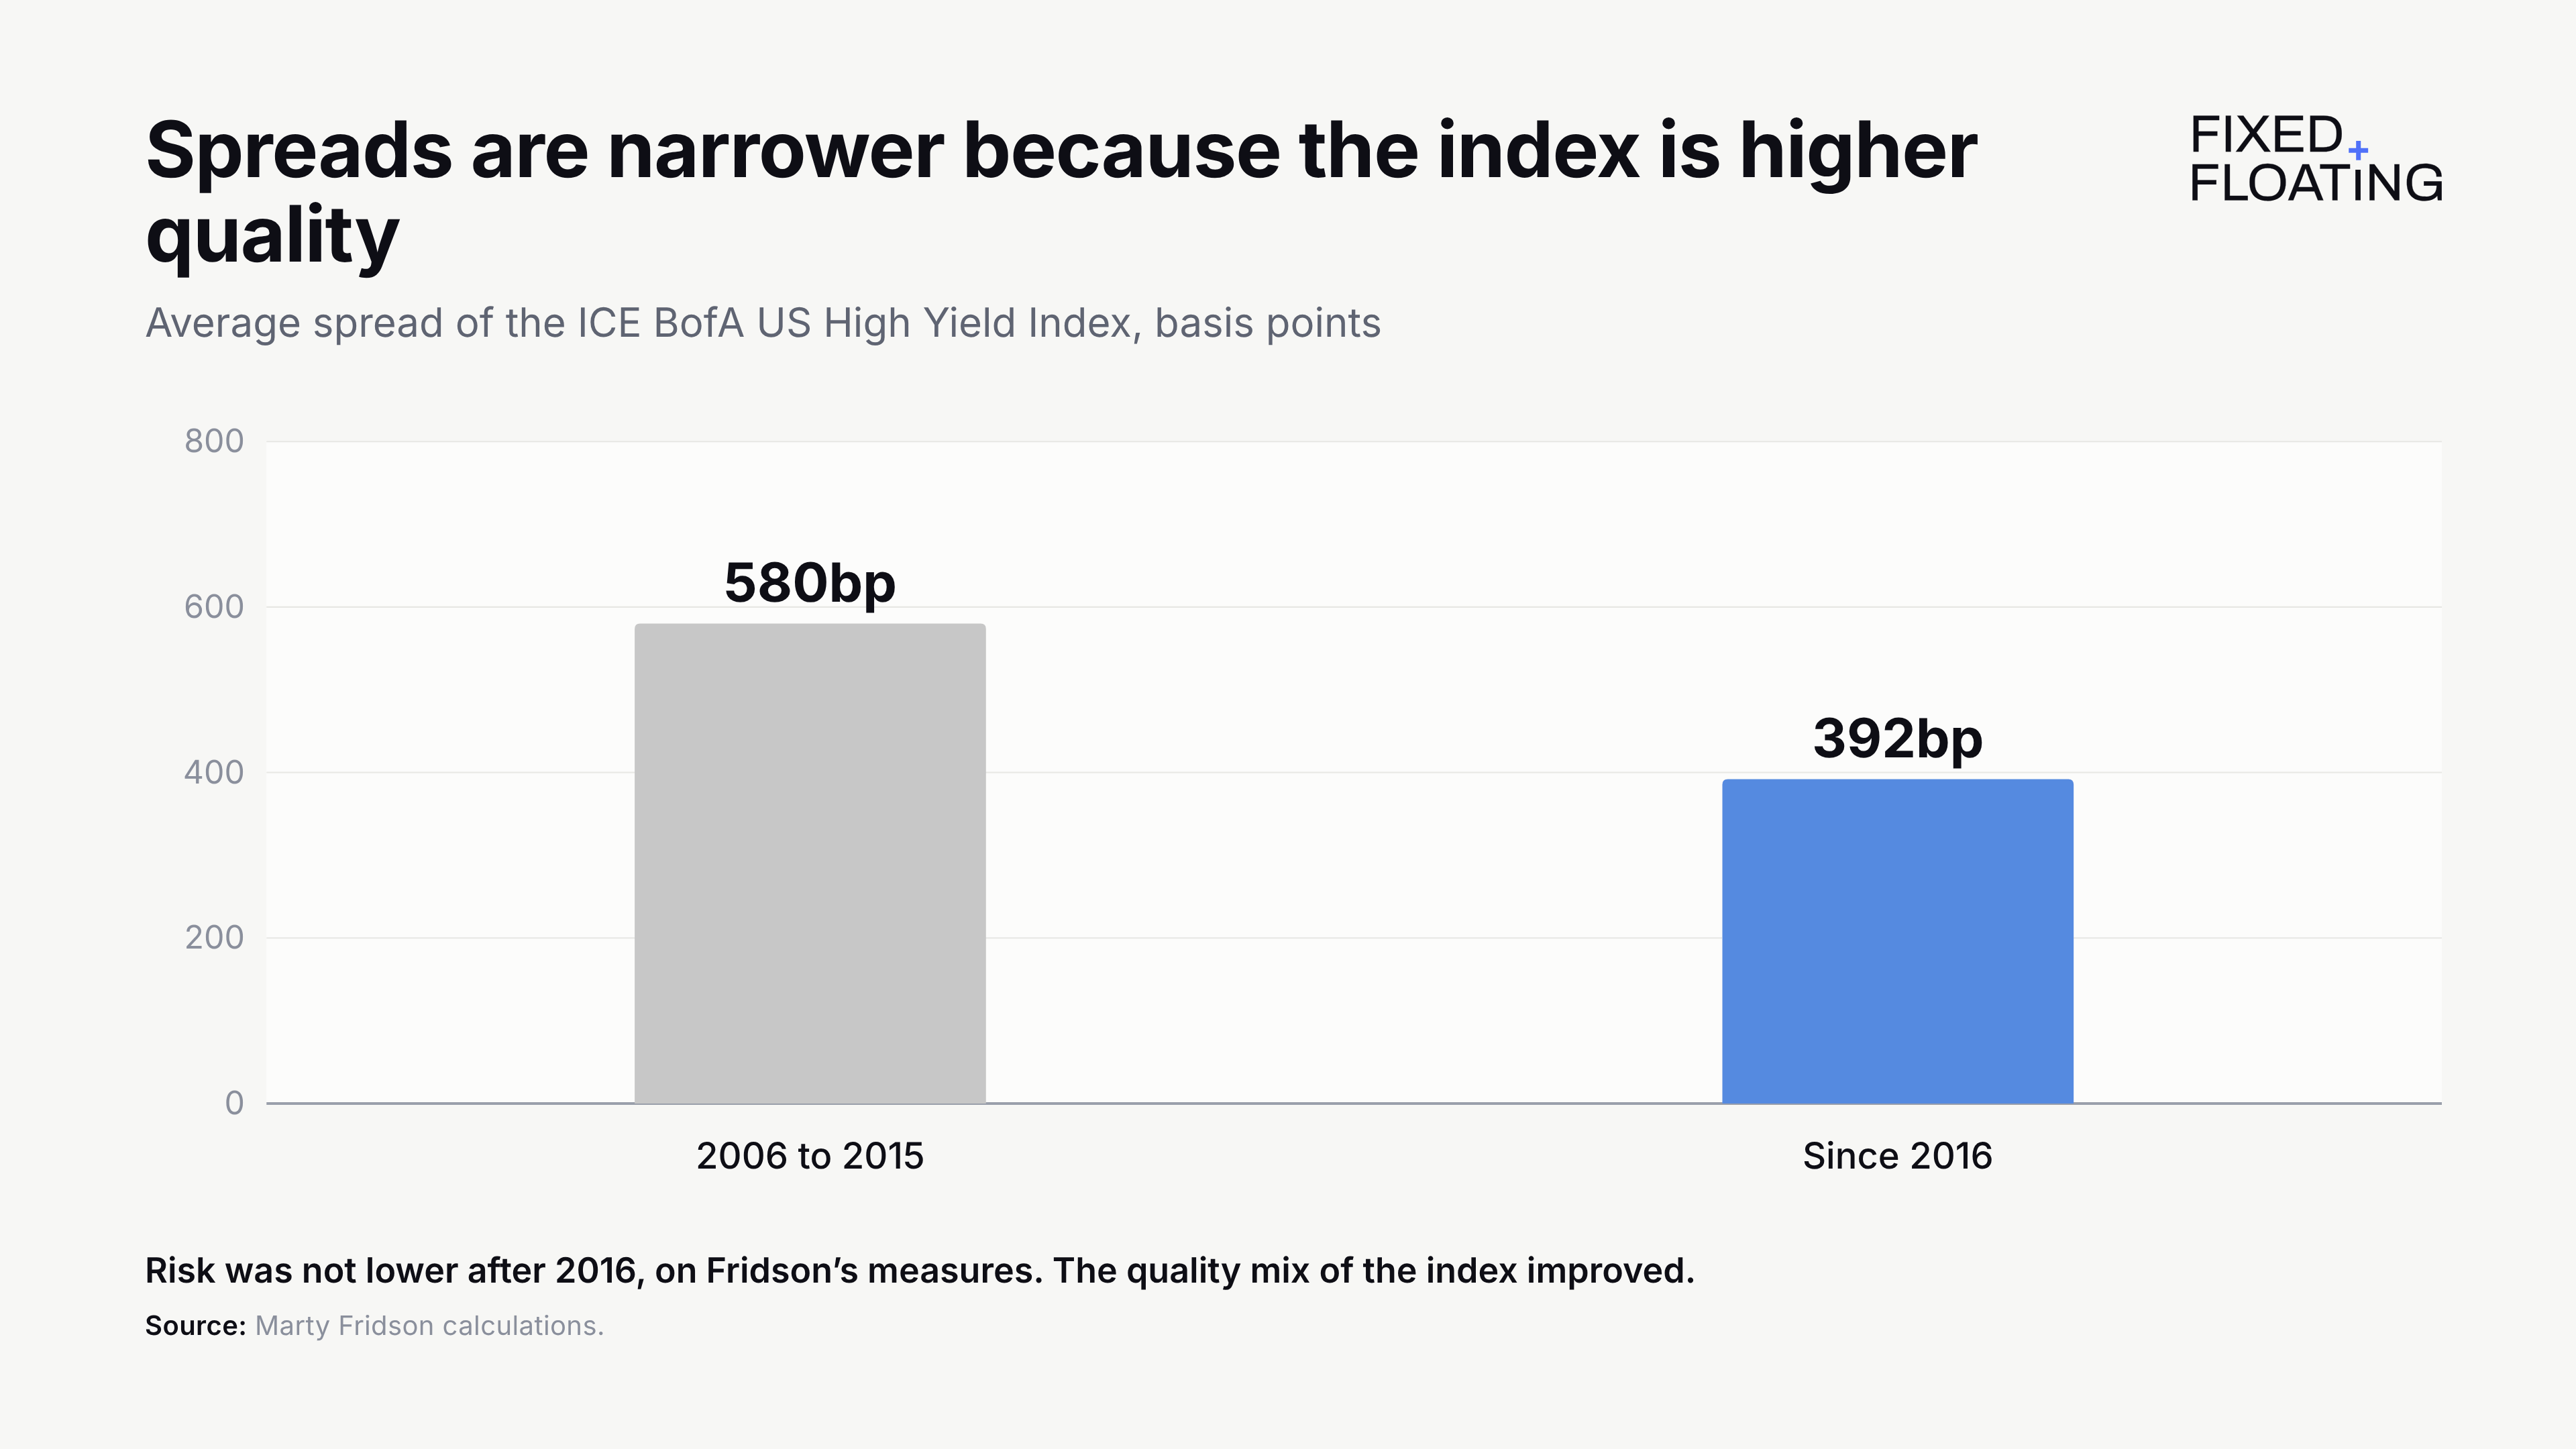
Fridson gave the numbers. Since 2016 the index spread has averaged 392bp. In the ten years before, it averaged 580bp. Fridson does not think conditions became easier. On his measures, “if anything, risk has been greater in the more recent period.”
“The only way to explain why spreads have been narrower in recent years is that the quality mix of the high-yield universe has improved,” Marty Fridson.
WHAT SETS FAIR VALUE
Fridson’s fair value model regresses the index spread on a set of market and index variables. The new version was rebuilt mainly to capture the change in the index’s quality mix. It adds the Treasury yield curve, the current default rate and the Office of Financial Research’s Financial Stress Index, and replaces one earlier variable.
The most important additions, he said, are the shares of face amount in CCC bonds and in secured debt. Credit availability, he said, “is a very powerful explainer.”
Companies refinance “before the wolf is at the door,” Fridson said. But they may have to refinance at higher levels, and that depends on banks’ willingness to lend and the standards they set. Lower-quality companies “may have to cross a very high bar.” If banks cut back, that “could cause disruption in the economy itself.” Speculative-grade spreads would then widen.
The new model does not change fair value radically. But for a manager who moves the allocation at a one-standard-deviation gap, it would have fired at points where the old one did not.
CHEAP, BUT NOT EXTREMELY SO
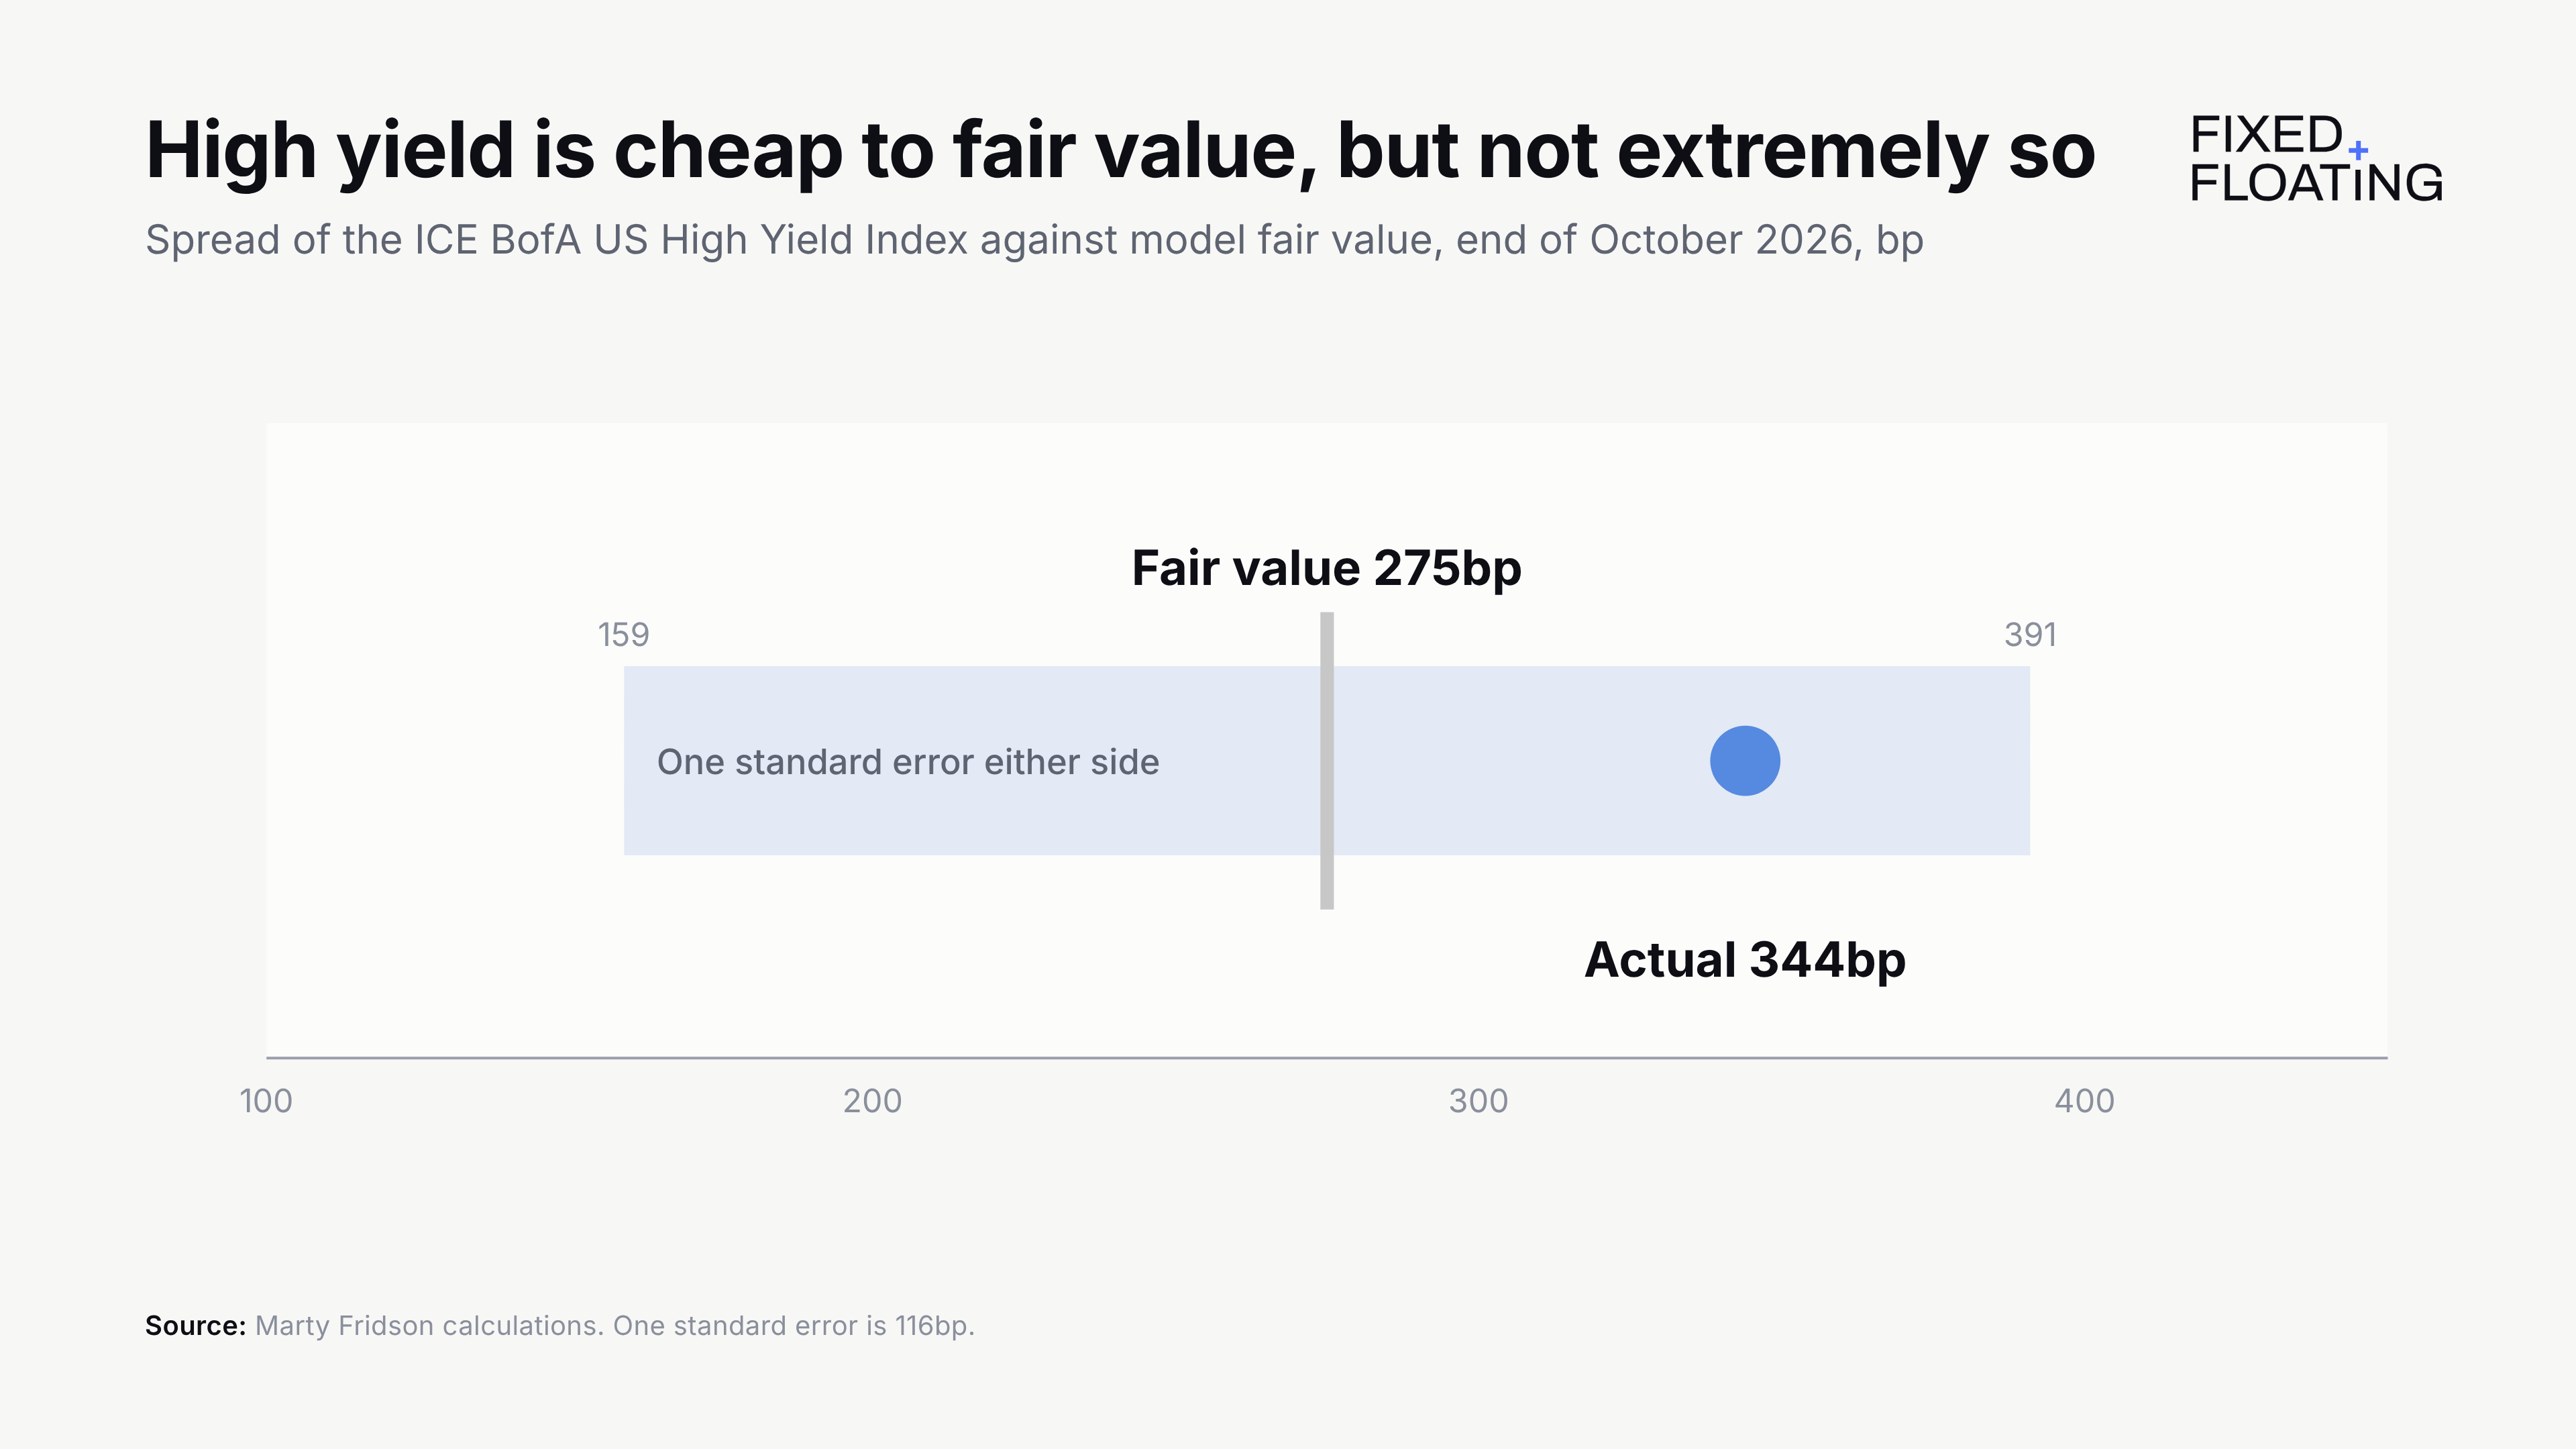
Spreads usually reach their widest in recessions, Fridson said, but that is not automatically the time to buy. A lot depends on how long the recession lasts. He would not pinpoint the month. Over a year, though, the model has identified good entry points. Supply-demand technicals can also make high yield cheap by one standard error, which was 116bp when we recorded.
At the end of October, the model put fair value at 275bp, well below historical averages. The actual spread was 344bp. “The high-yield market was somewhat undervalued, although not extremely so,” Fridson said. On our arithmetic, the gap of about 70bp is inside that 116bp band.
Fridson’s inputs explain the low fair value. Banks are willing to lend, the economy is doing well, the yield curve is fairly positive and there is no pronounced financial stress.
The rise in Treasury yields has pulled fair value lower still. As a trader, Fridson was taught “the exact opposite.” In fact, when Treasury yields are high, the spread tends to be lower.
His explanation is demand for capital. Companies that see good earnings prospects borrow to expand, which pushes rates up, so a smaller risk premium makes sense. Liability-driven buyers such as life insurers also care about the absolute yield, and accept a smaller premium when yields are higher.
WHY CCCs LAGGED
I asked why CCCs underperformed so badly this year, after looking cheap at the start of it. My own reading was rising real rates.
Fridson started from history. It is normal for CCC & lower to widen more than BBs and Bs when the market widens. Since the end of 2025, the combined BB/B spread has widened by 45bp. On historical modelling, that implies just over 100bp of widening for CCC & lower. Instead they widened by almost 250bp.
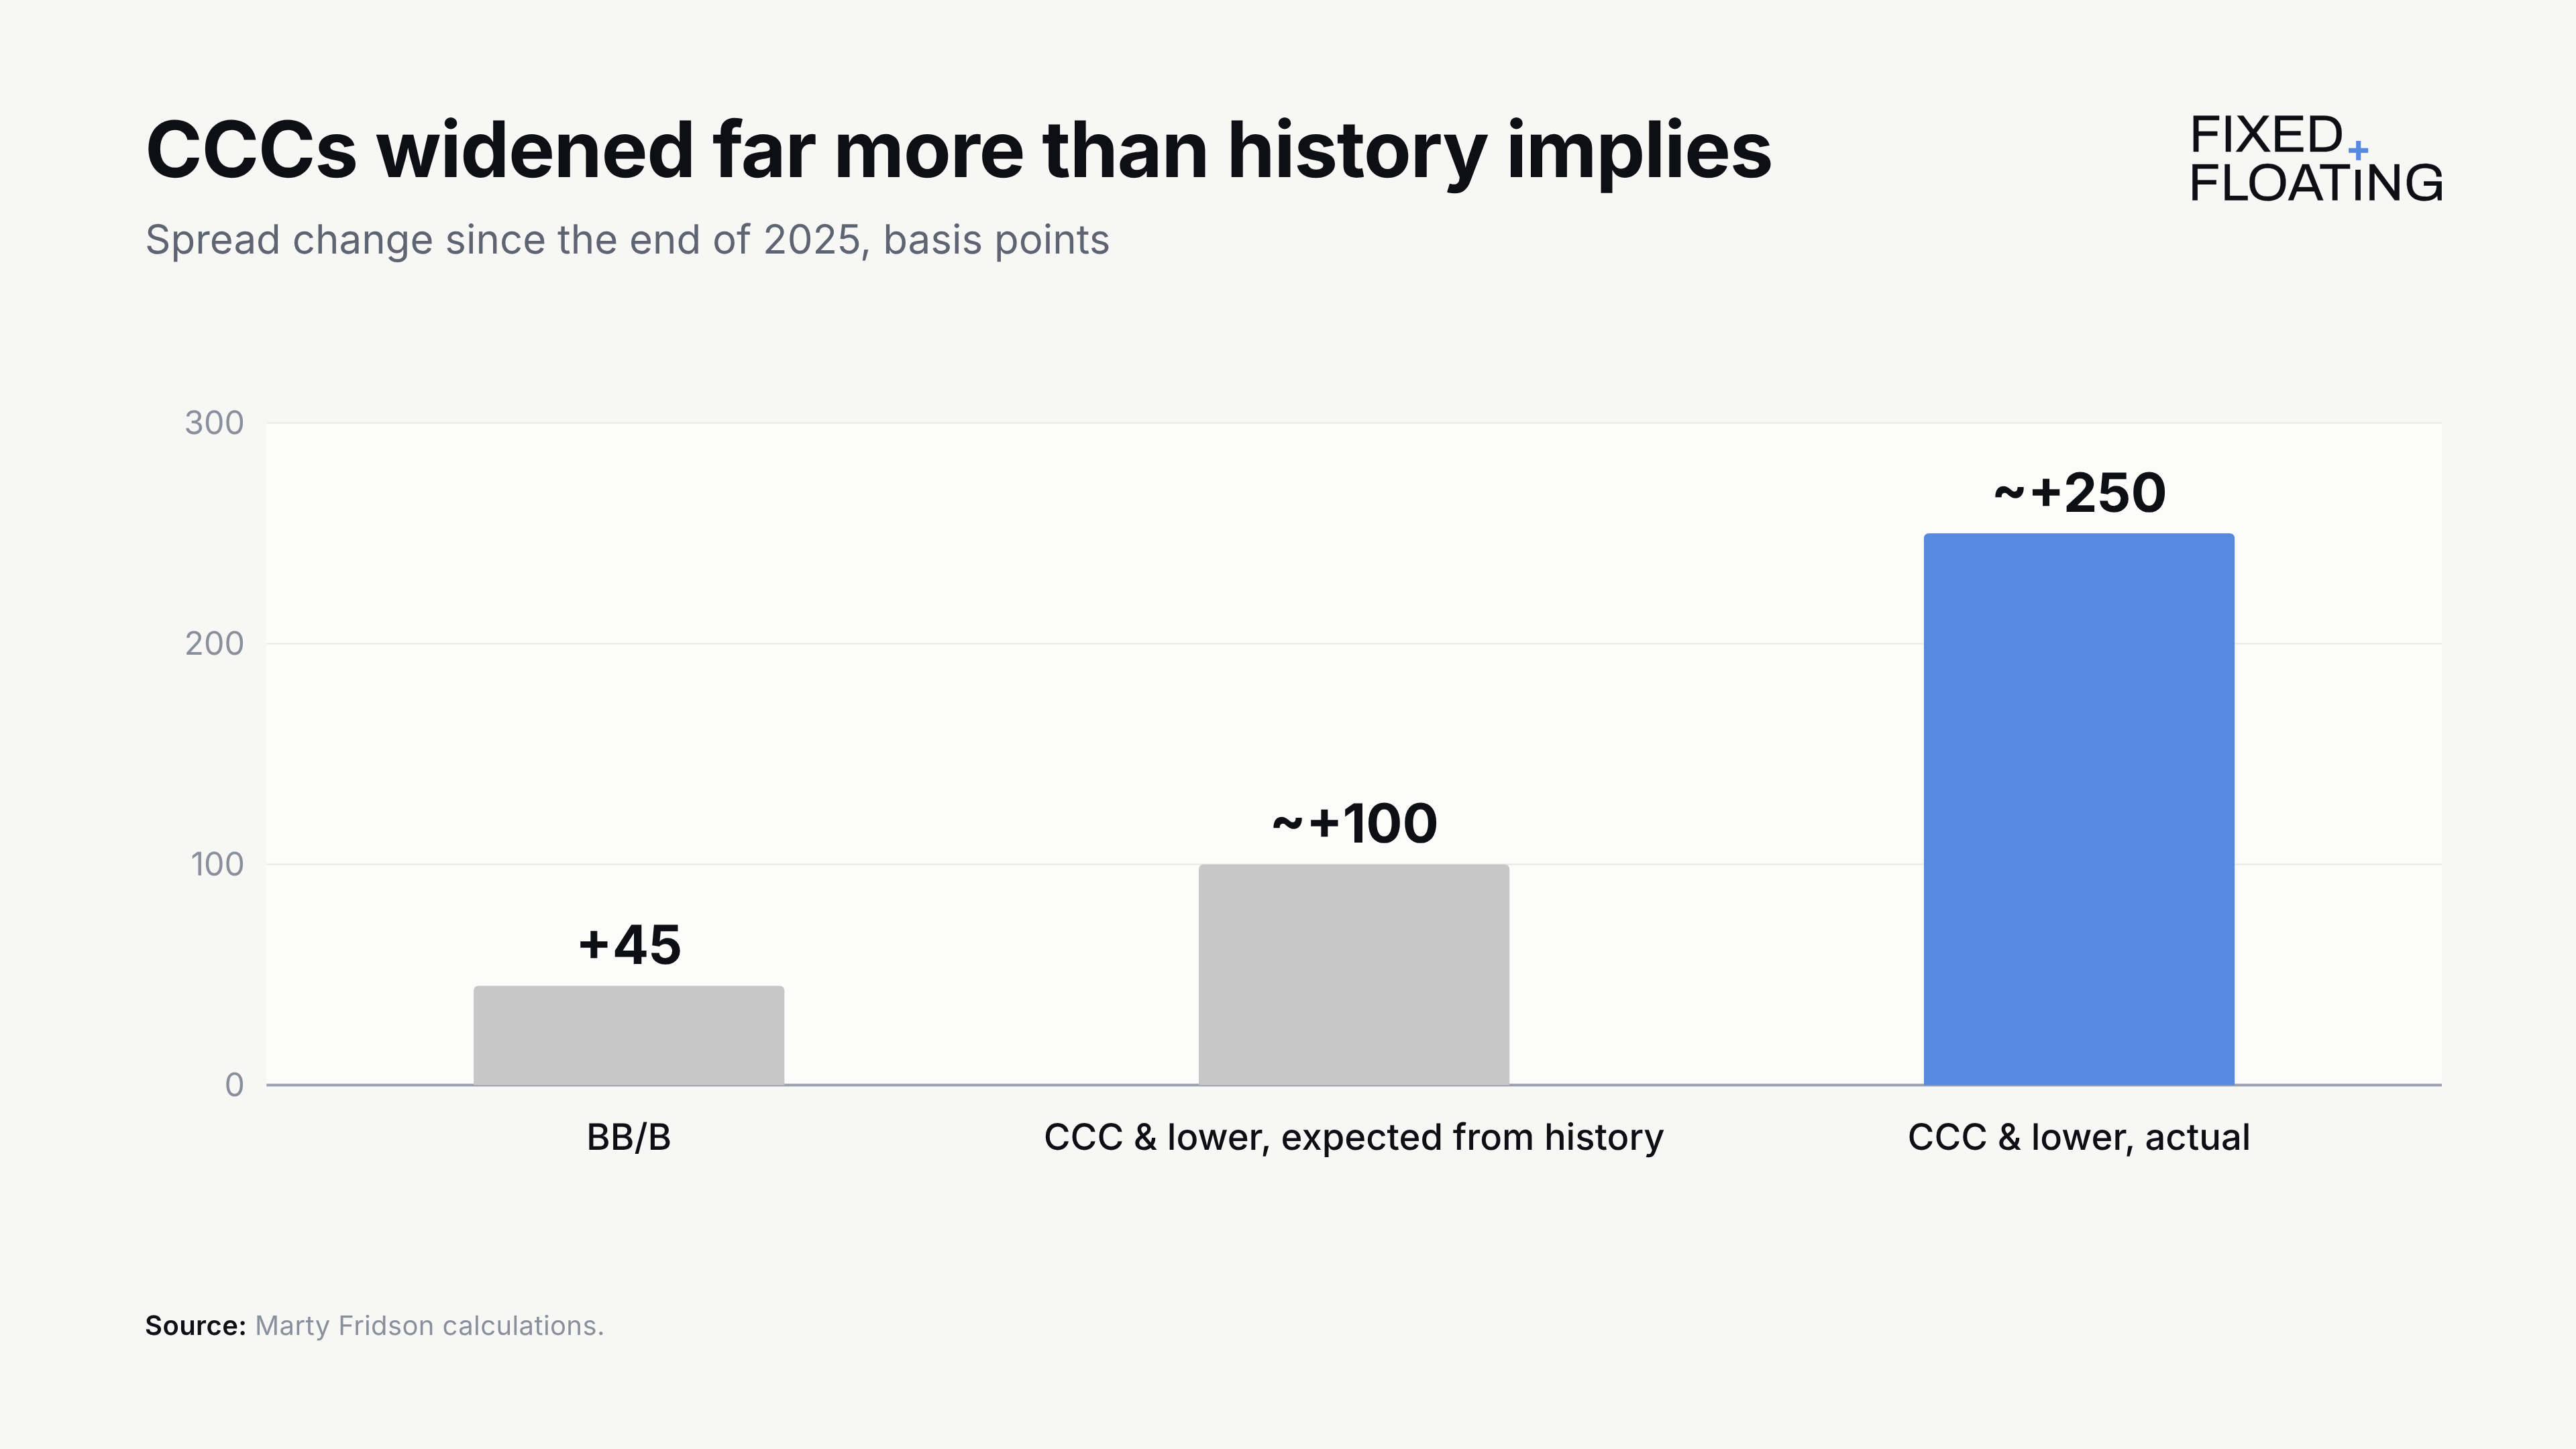
His explanation was the economic outlook. “They are very concerned about the possibility of a weakening of the economy, even though the indicators aren’t particularly pointing that direction,” he said of investors. They are hedging their bets and skewing toward the medium- to higher-quality part of the market.
The mechanism is interest coverage. CCC companies have a smaller cushion against an economic decline. When EBITDA falls, coverage ratios decline at BBs and Bs too, but they still cover their interest by a comfortable margin. Many CCCs end up barely covering it, or not covering it at all. For them, “the risk of a near-term default suddenly becomes very real.”
Who holds CCCs makes the move sharper, Fridson said. Many high yield funds avoid CCCs, so the natural holders are risk-oriented investors, including mutual funds competing on yield. Their investors are “renting that investment rather than buying it,” Fridson said, and can redeem the same day. To meet redemptions, the funds have to sell bonds that lacked liquidity to begin with. “You can see some real gapping in the prices.”
DISTRESSED: THE MARKET PRICES FEWER DEFAULTS
Fridson backs out the default rate the market is pricing and compares it with Moody’s forecast. I put the test to him this way. Distressed debt is attractive when the market prices a default rate a point or more above the forecast.
Moody’s was forecasting a 3.1% default rate for US speculative-grade bonds over the next 12 months. Fridson’s own method, which avoids reading defaults off the spread to Treasuries, put the market-implied rate at 1.8%. That is more than a point below the forecast. “So the distressed market as a whole is not especially attractive right now.” There are always individual situations with very good risk-reward, he added.
For a single CCC, Fridson adds the dollar price against expected recovery and the current yield. The higher the current yield, the more you earn back before a default. “I don’t think there’s a single measure that replaces the spread,” he said.
THE CHEAP BONDS ARE COMPANY-SPECIFIC
Fridson also runs a screen for severely undervalued bonds. It uses only financial statement data to estimate the spread each bond ought to have. It flags bonds whose actual spread is out of line, whatever their rating.
Near the top of the list on 30 October, from his screen:
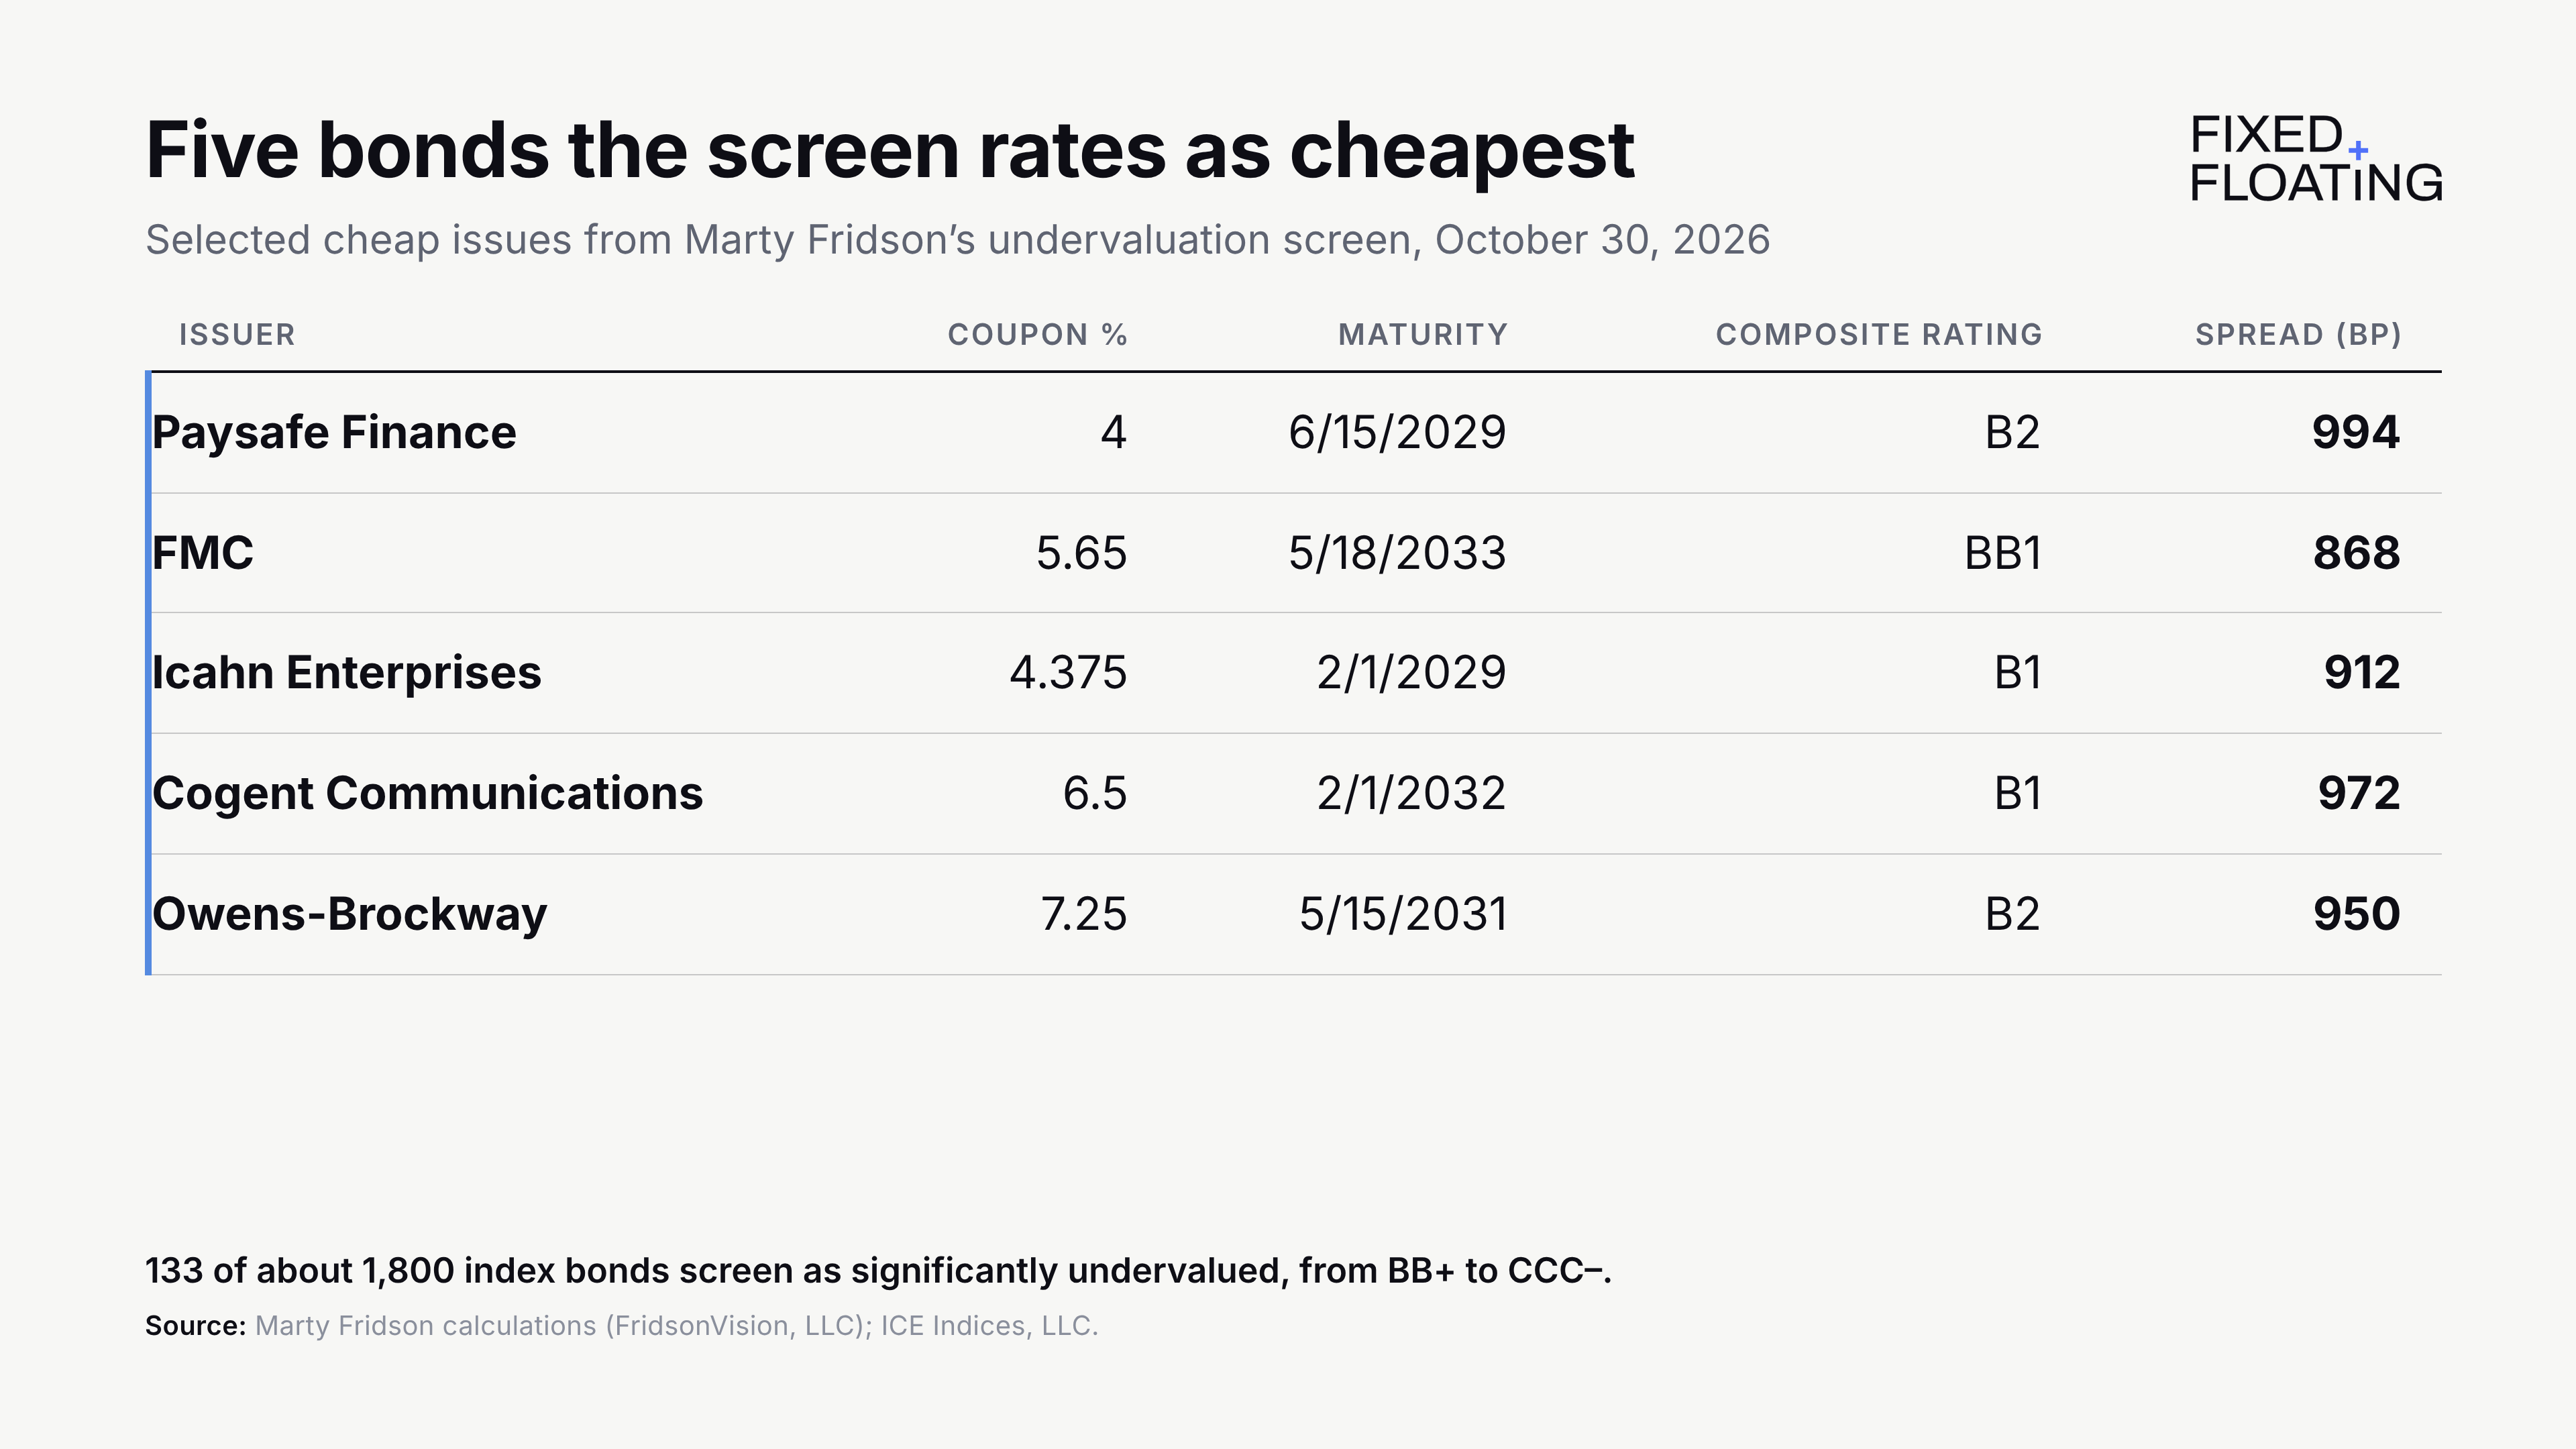
133 of about 1,800 bonds in the index screen as significantly undervalued. They run from BB+ to CCC–, across industries, led by financial services, then media and healthcare. “It really is a very company-specific situation,” Fridson said.
An outside firm that validates managers’ performance records has attested to the screen’s results, he said. Outside periods when financial markets do so badly that nothing works, the success ratio is very high.
When a cheap bond fails, often nothing went wrong: the market simply did not change its mind within the year. Sometimes there is a setback no one could foresee, such as a lost customer or an accident at a plant.
ONE HIGH YIELD UNIVERSE
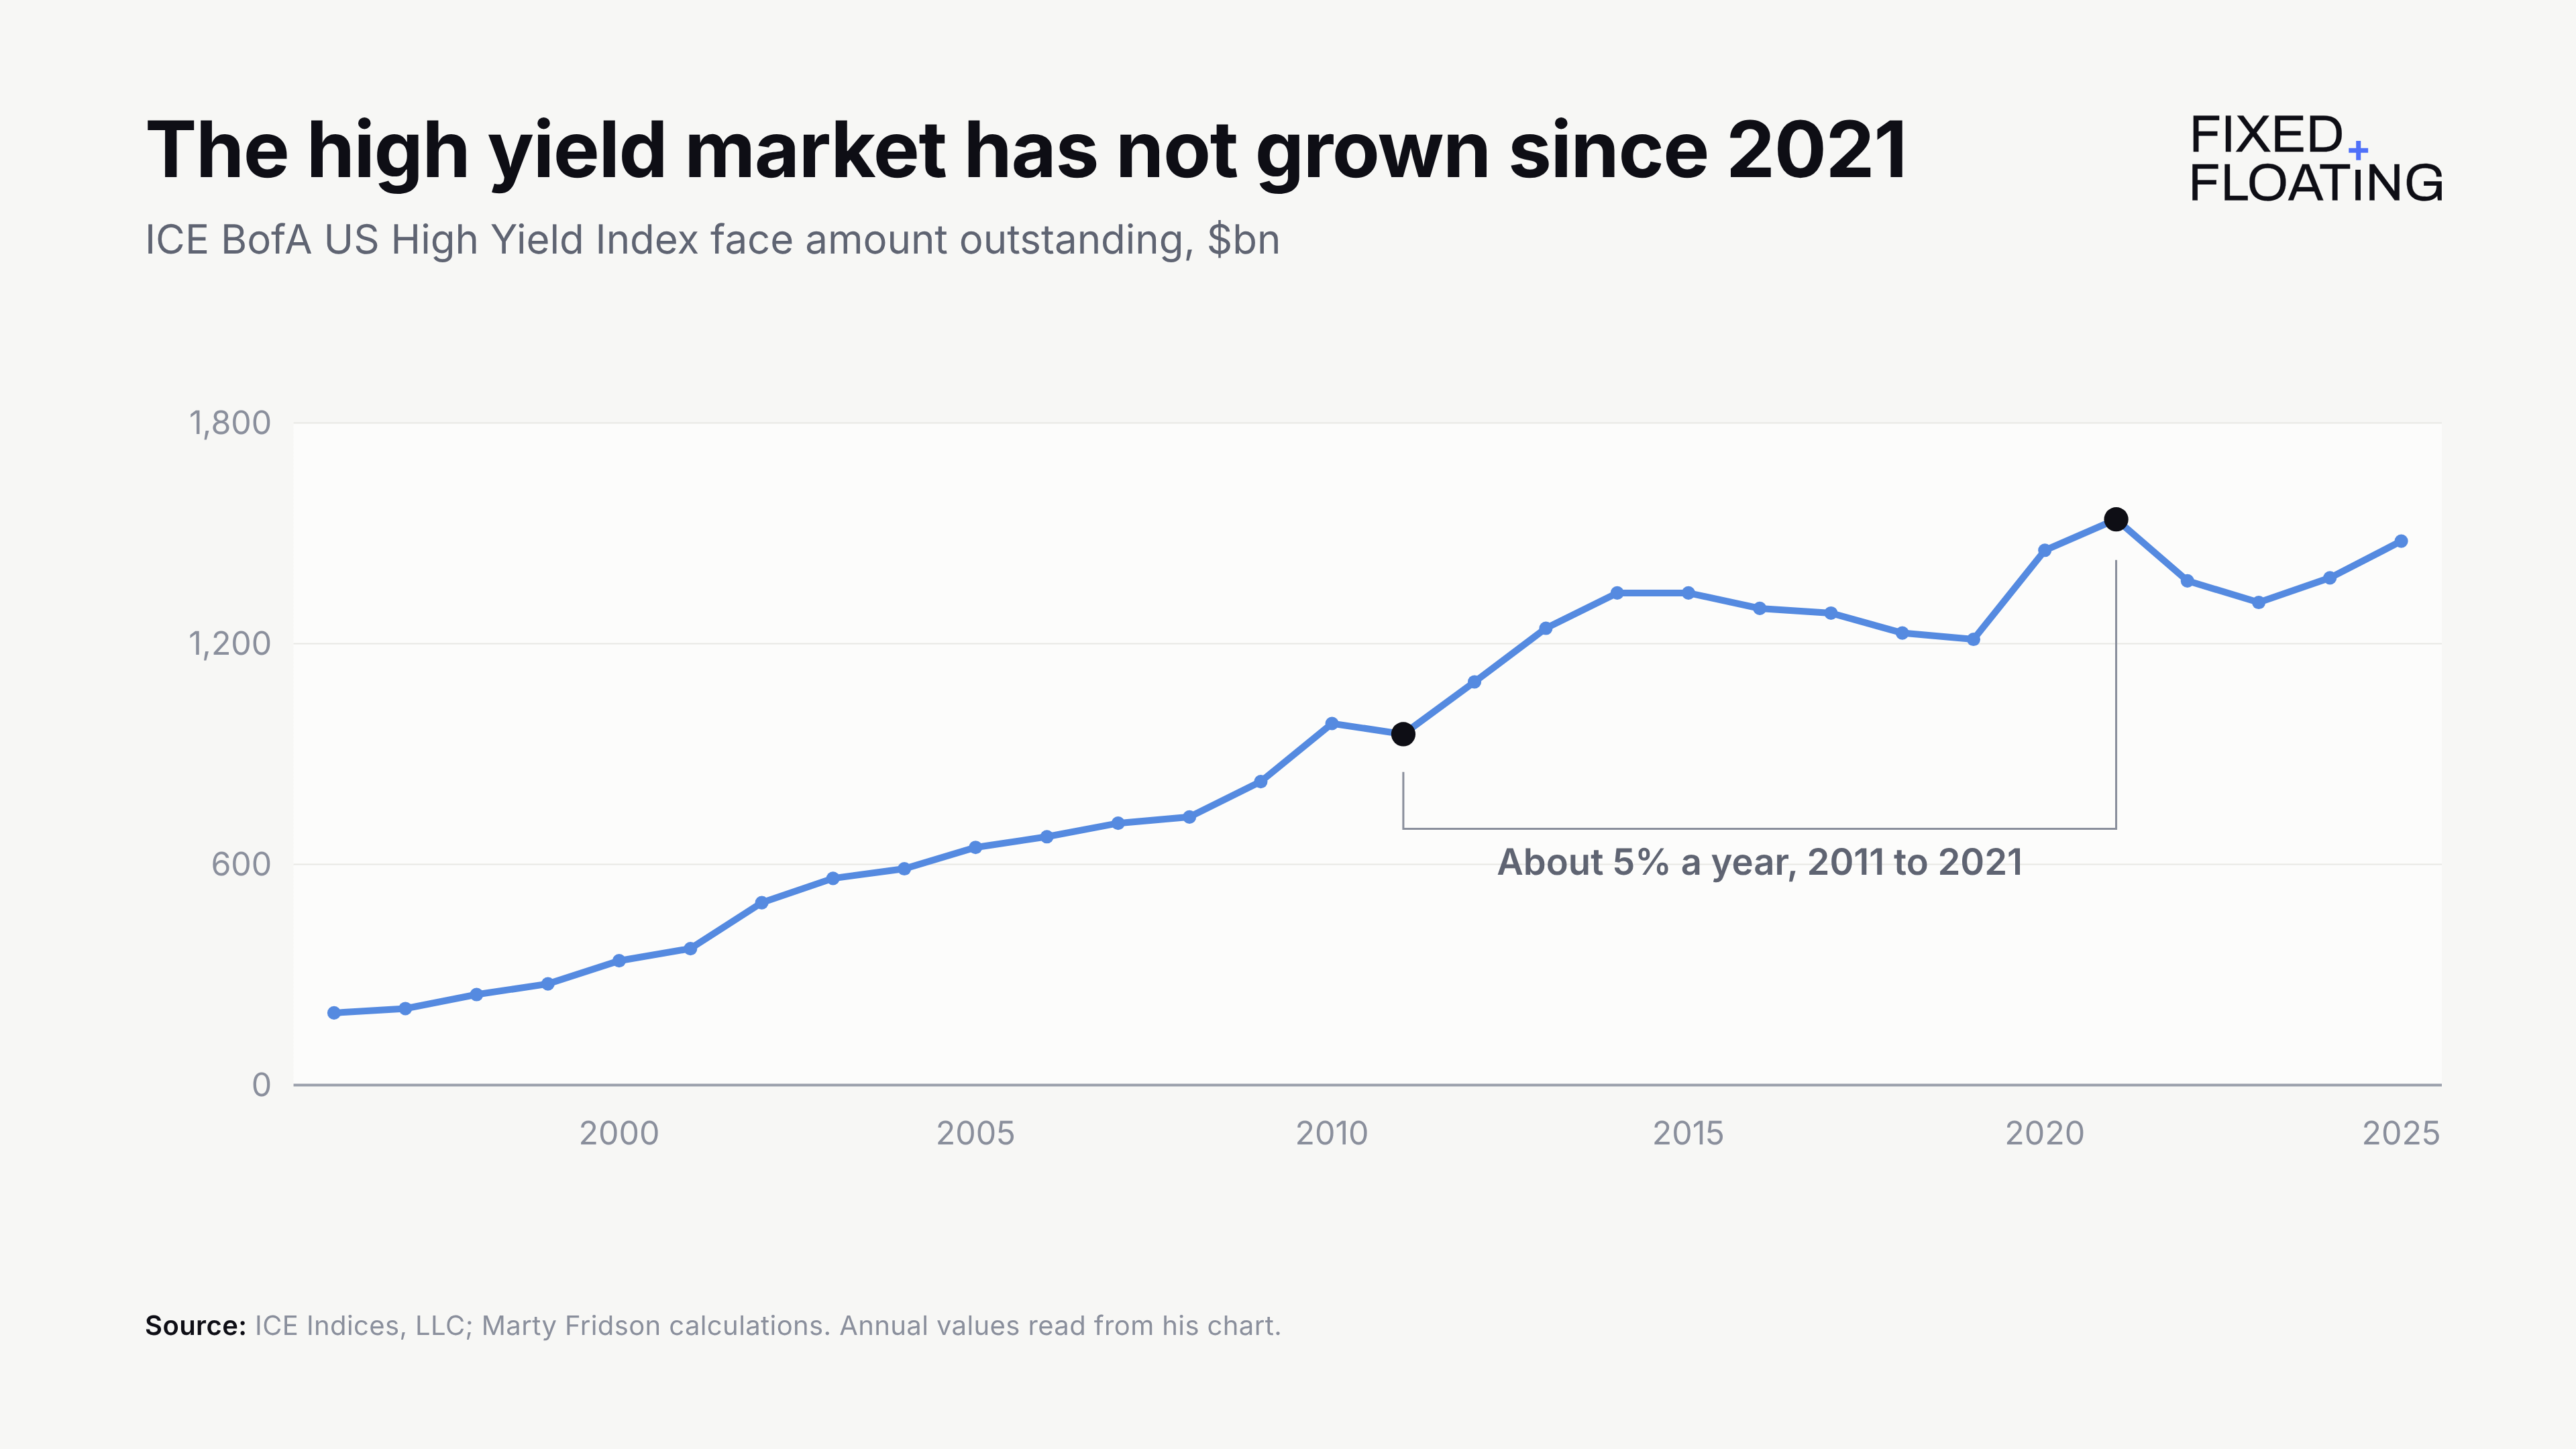
The market itself has stopped growing. The amount outstanding has not grown over the last five years, after growing at about 5% a year from 2011 to 2021. Had that continued, the market would be about half a trillion dollars, or a third, larger today, Fridson said.
Does the public spread still represent the asset class, when riskier borrowers have moved to private credit? Fridson thinks so. “An asset class is different from a universe of issuers.” The high yield spread measures risk in the public bond market. Many issuers also borrow in private credit or syndicated loans. Private credit will need to change how its contracts are written after the next recession, he expects.
New issuers bring their own pressure. AI issuers have “a very large appetite for debt,” and data centres are expensive. That supply could strain the market’s capacity to absorb it in the short run, without changing the fundamentals of other issuers. “We might see an extended period of the high-yield universe trading at a discount to its fair value,” he said.
So how do you tell a safer market from an expensive one? “There’s only one high-yield universe,” Fridson said. The safer market is one where the spread compensates you adequately for the risk. An expensive one does not, and is “very vulnerable to the market very suddenly finding the right level to price that risk at.”
MARTY FRIDSON ON…
TOP-DOWN AGAINST BOTTOM-UP. Some managers who rose as industry analysts underestimate top-down factors, Fridson said. “Even a good credit in a bad industry will feel the effect of the market losing interest in that industry.”
BORROWING COSTS AND THE HEADLINES. Higher rates would be a crisis only if companies borrowed short term at floating rates. New debt is averaged into the overall cost of debt.
OIL AND THE ALLOCATION. Fridson does not forecast the economy. But you are likely to raise your high yield allocation if you think GDP and corporate earnings in 2027 will beat what the market believes. Energy is the largest component of the index, so higher oil prices argue for more, provided other companies can pass the cost on.
I think you sometimes get carried away and only look at the index headline number, without really caring about the underlying risk in the index. With high yield you are not buying broad leveraged finance risk. You are buying a sub-index, which has changed materially over time.
The strongest objection to Fridson’s verdict is that cheap can stay cheap. He gave one reason it might: AI supply could keep the market at a discount to fair value for an extended period. Is the discount an opportunity or a warning? Let us know in the comments.
ABOUT THE GUEST
Marty Fridson is Chief Investment Officer of Lehmann Livian Fridson Advisors, which runs separately managed accounts across income investments. He started as a corporate bond trader in 1976 and worked at Salomon Brothers, Morgan Stanley and Merrill Lynch. He was ranked first in high yield strategy in the Institutional Investor All-America Research Survey for nine consecutive years. He has served as president of the Fixed Income Analysts Society and as a governor of the CFA Institute, and is a member of the Fixed Income Analysts Society Hall of Fame. He is the author of Financial Statement Analysis: A Practitioner’s Guide, now in its fifth edition.
LinkedIn · Lehmann Livian Fridson Advisors · martinfridson.com · X
CHAPTERS
00:00 Cold open
00:28 Introduction: US high yield near its tights
01:30 Marty Fridson’s 50 years in credit
02:50 Myths in the history of the high yield market
06:41 Do fallen angels outperform after a downgrade?
09:55 Do dividend cuts help bondholders?
11:32 How the index changed: fewer CCCs, more secured bonds
16:08 Is a spread above its long-run average cheap?
19:02 Fridson’s fair value model of the high yield spread
24:02 When high yield has been cheap
25:46 Fair value today: 275bp against 344bp
28:18 Why Treasury yields move against spreads
30:59 Rising real rates and corporate borrowing costs
34:12 Why CCCs underperformed BBs and Bs
38:17 Who holds CCCs and why prices gap lower
41:33 Market-implied default rate against Moody’s forecast
43:00 Valuing a CCC bond: dollar price and current yield
44:38 Fridson’s screen for undervalued bonds
46:20 The most undervalued high yield bonds now
49:03 Top-down against bottom-up in high yield
53:07 When cheap bonds don’t outperform
54:58 High yield and private credit: a market that stopped growing
57:54 AI issuance and the high yield market
59:20 Safer against more expensive high yield
01:01:21 When to raise a high yield allocation
SUPPORT MATERIAL

Fixed + Floating
Fixed + Floating is a credit podcast hosted by Portfolio Manager Josef Pschorn. Long-form conversations with credit market practitioners - portfolio managers, analysts, restructuring advisers and academics - on private credit, high yield, distressed debt, CLOs, liability management and credit policy.
Subscribe to Fixed + Floating on YouTube · Spotify · Apple Podcasts
Follow Fixed + Floating on X · Fixed + Floating on LinkedIn
Follow Josef on LinkedIn
If there is a guest or a topic you want covered, reply to this post or message me on LinkedIn.
Fixed + Floating is for informational purposes only. Not investment, legal or tax advice. Guest views are their own and do not represent their employer.
REFERENCES
Martin Fridson and Fernando Alvarez, Financial Statement Analysis: A Practitioner’s Guide, 5th edition, Wiley.


