

One Housing Trade, Ten Tickers: The Floor in Building Materials Credit
E13 – Andy Belton (CreditSights) makes the structural case for why heavyside beats lightside in credit terms and why the US HY building products index is a single housing trade.

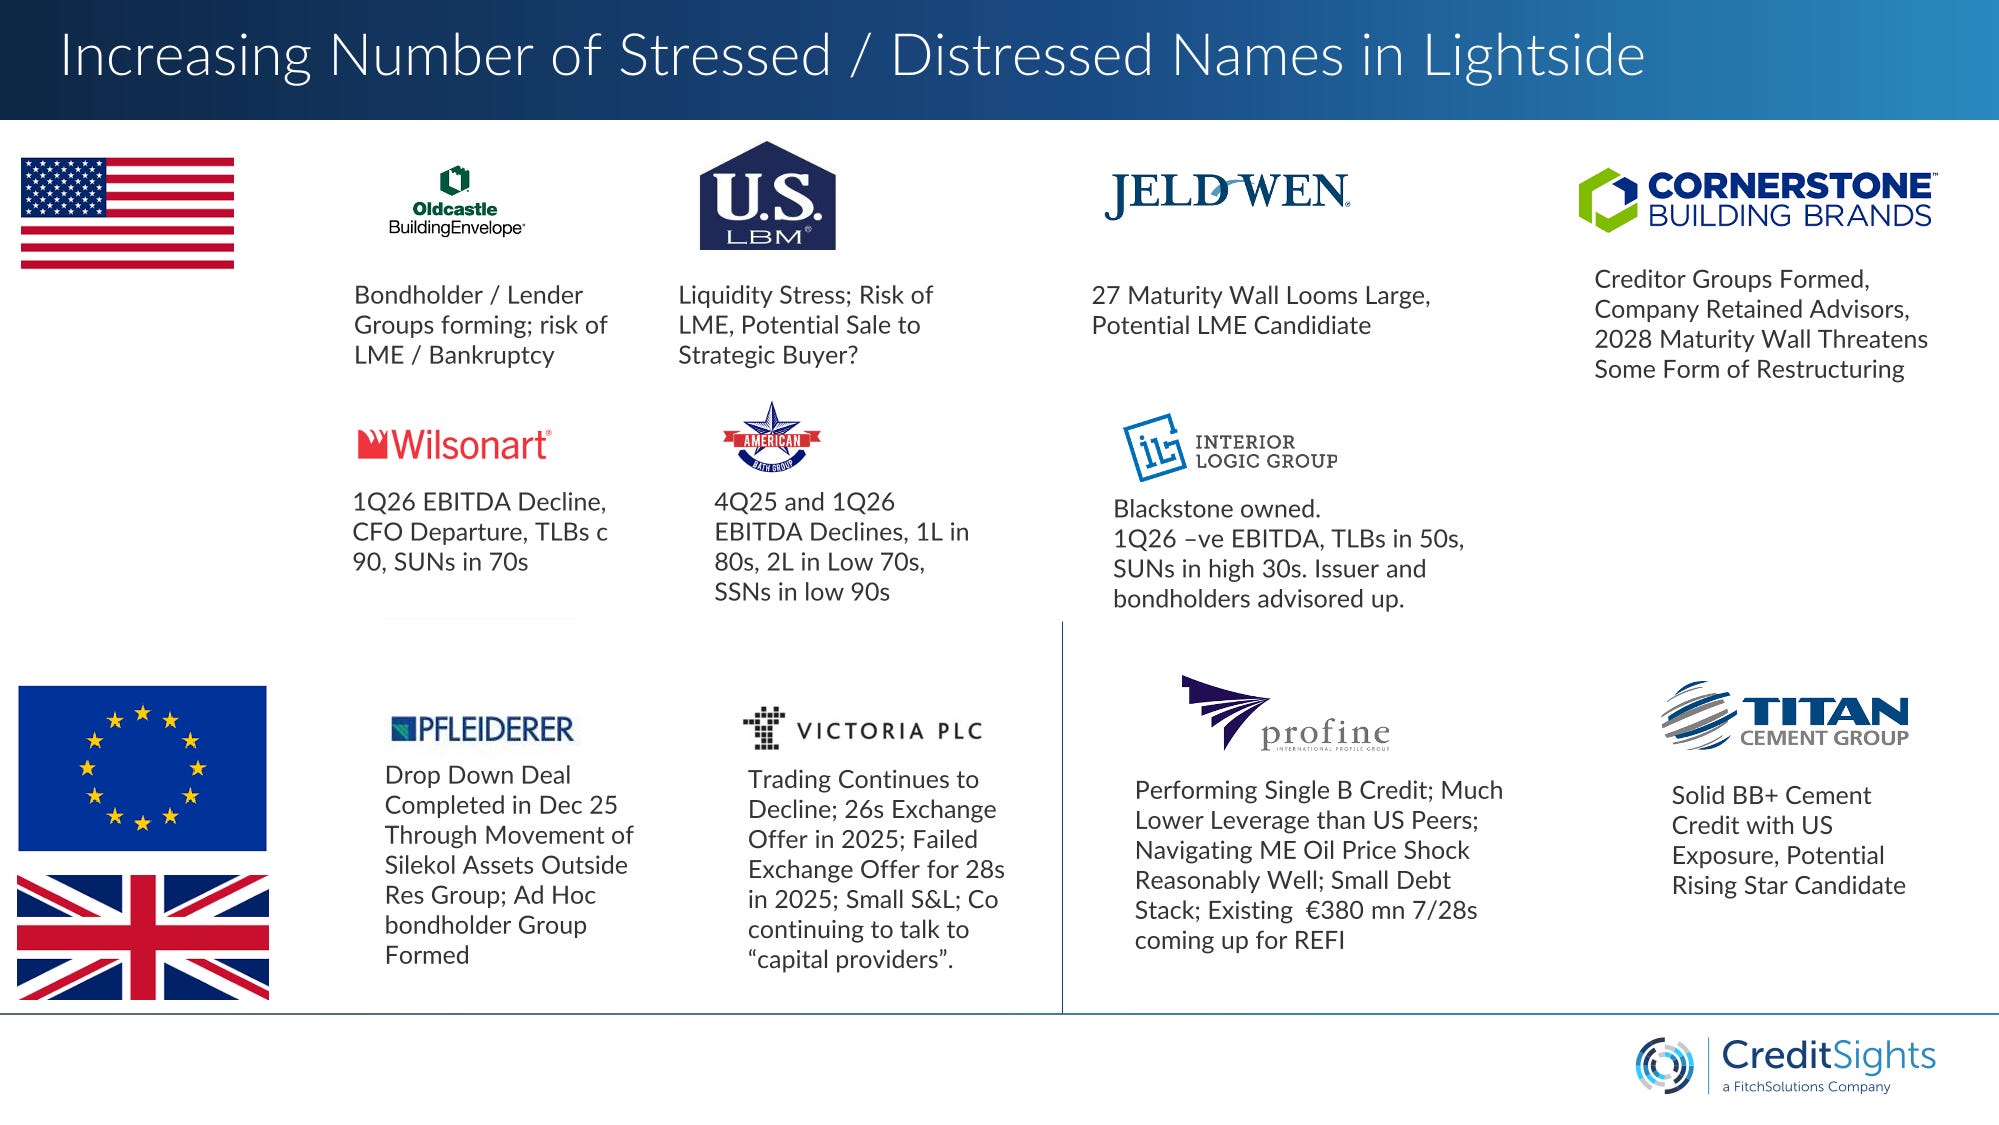
The first quarter of 2026 ended with five US high‑yield building products credits in concurrent distress — Cornerstone, JELD‑WEN, Oldcastle Building Envelope, USLBM, and Flytec among the most visible — while Germany’s Pfleiderer executed a drop‑down that moved its Silekol adhesives business outside the restricted group, raising fresh super‑senior debt over existing noteholders. In the same week, QXO agreed a 17 billion dollar takeover of TopBuild, the largest light‑side transaction in years. Stress and premium at both ends of the sector, simultaneously, on both sides of the Atlantic.
Markets have explained this as a macro story: weak housing starts, elevated mortgage rates, the post‑pandemic volume hangover, the natural run‑off of IRA and CHIPS Act manufacturing capex. All of those are real. But they are accelerants. The fuel was already there in capital structures sized at peak 2021–22 EBITDA for a volume trajectory that never persisted, and in business models that have very different floors when volumes move against them.
The rest of this piece is a structured walk‑through of why that matters for credit — beginning with the structural asymmetry between heavyside and lightside as credit propositions, then the demand and operating‑leverage mechanics that are now exposing the difference, then the anatomy of distress in JELD‑WEN and Pfleiderer, and closing with the three things I will actually be watching in HY building products over the next twelve to twenty‑four months.
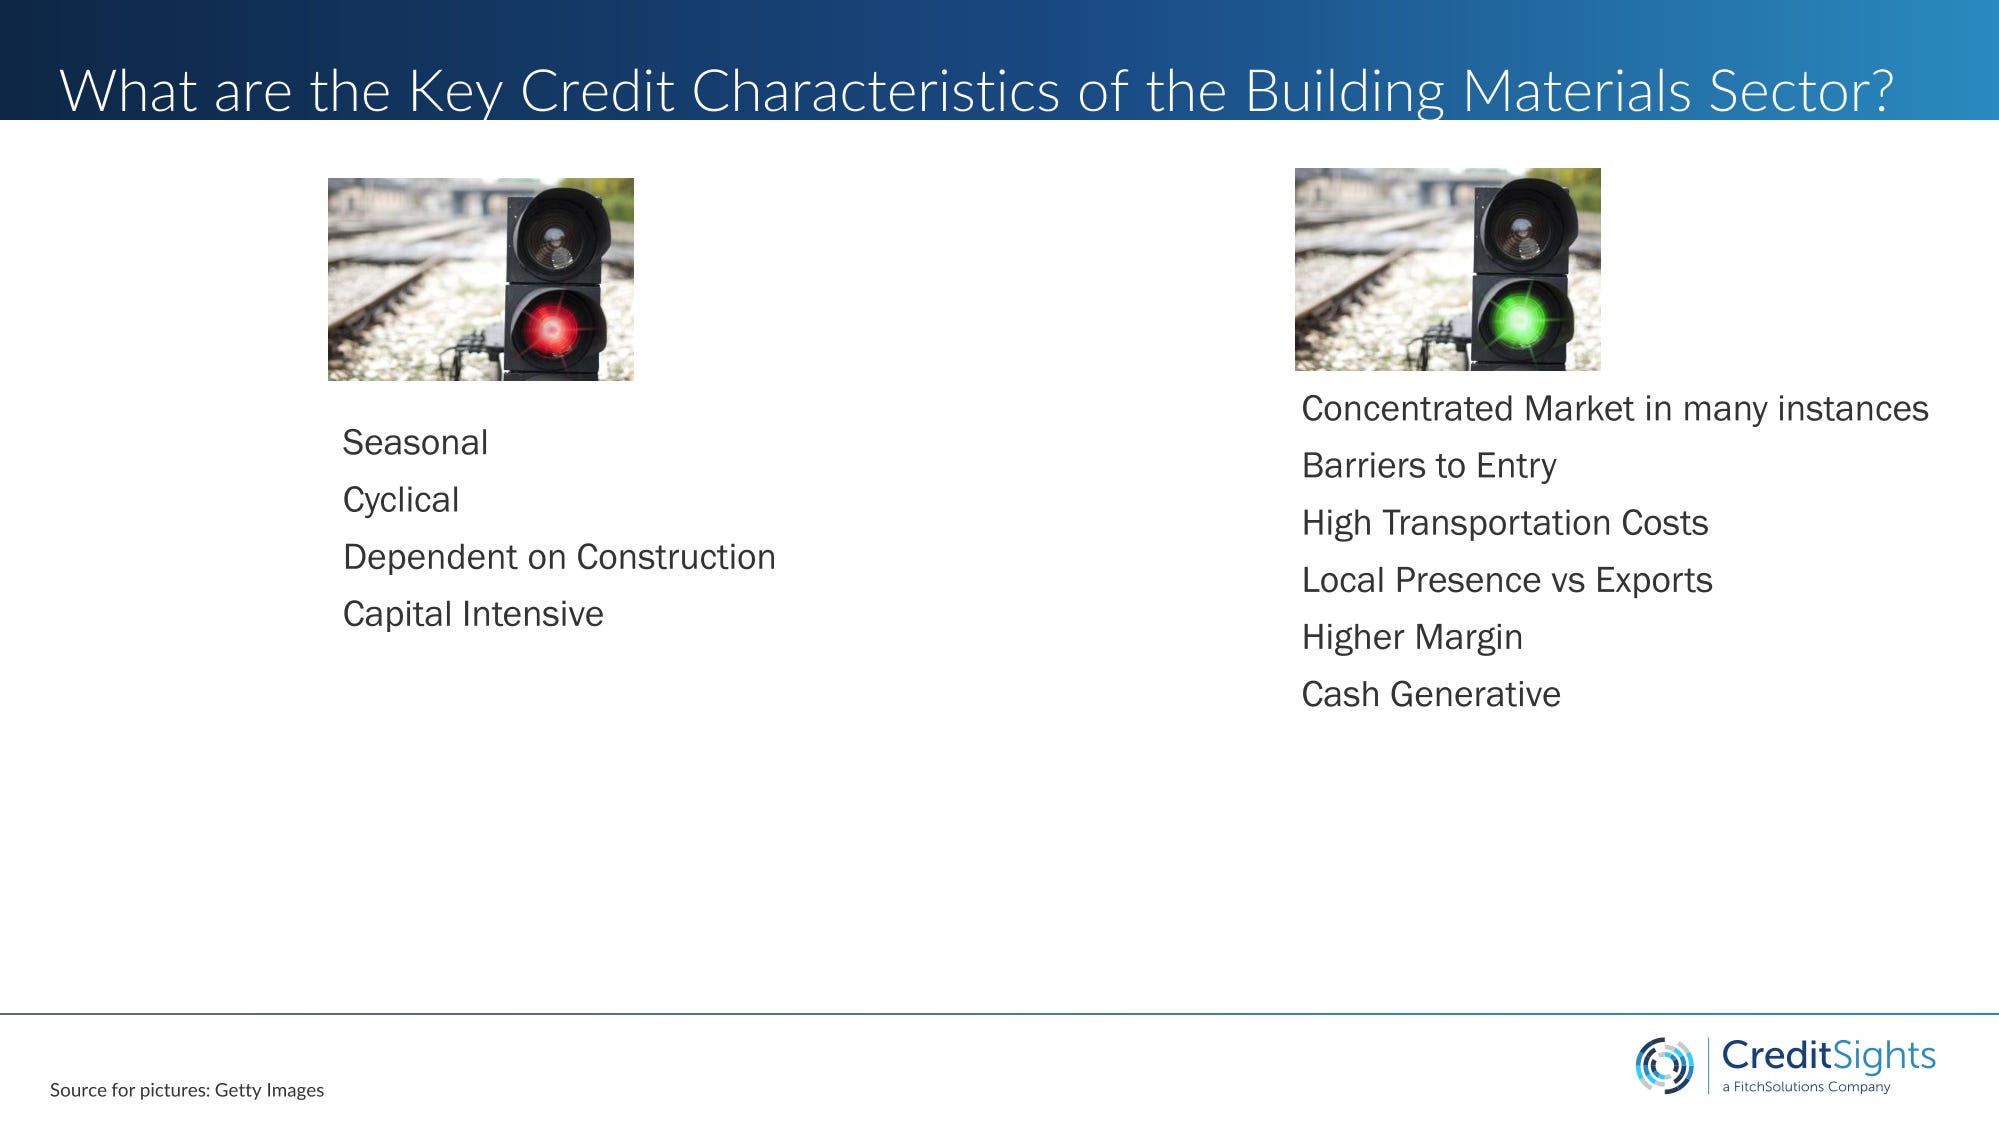
The Structural Asymmetry: Why the Floor Is Different
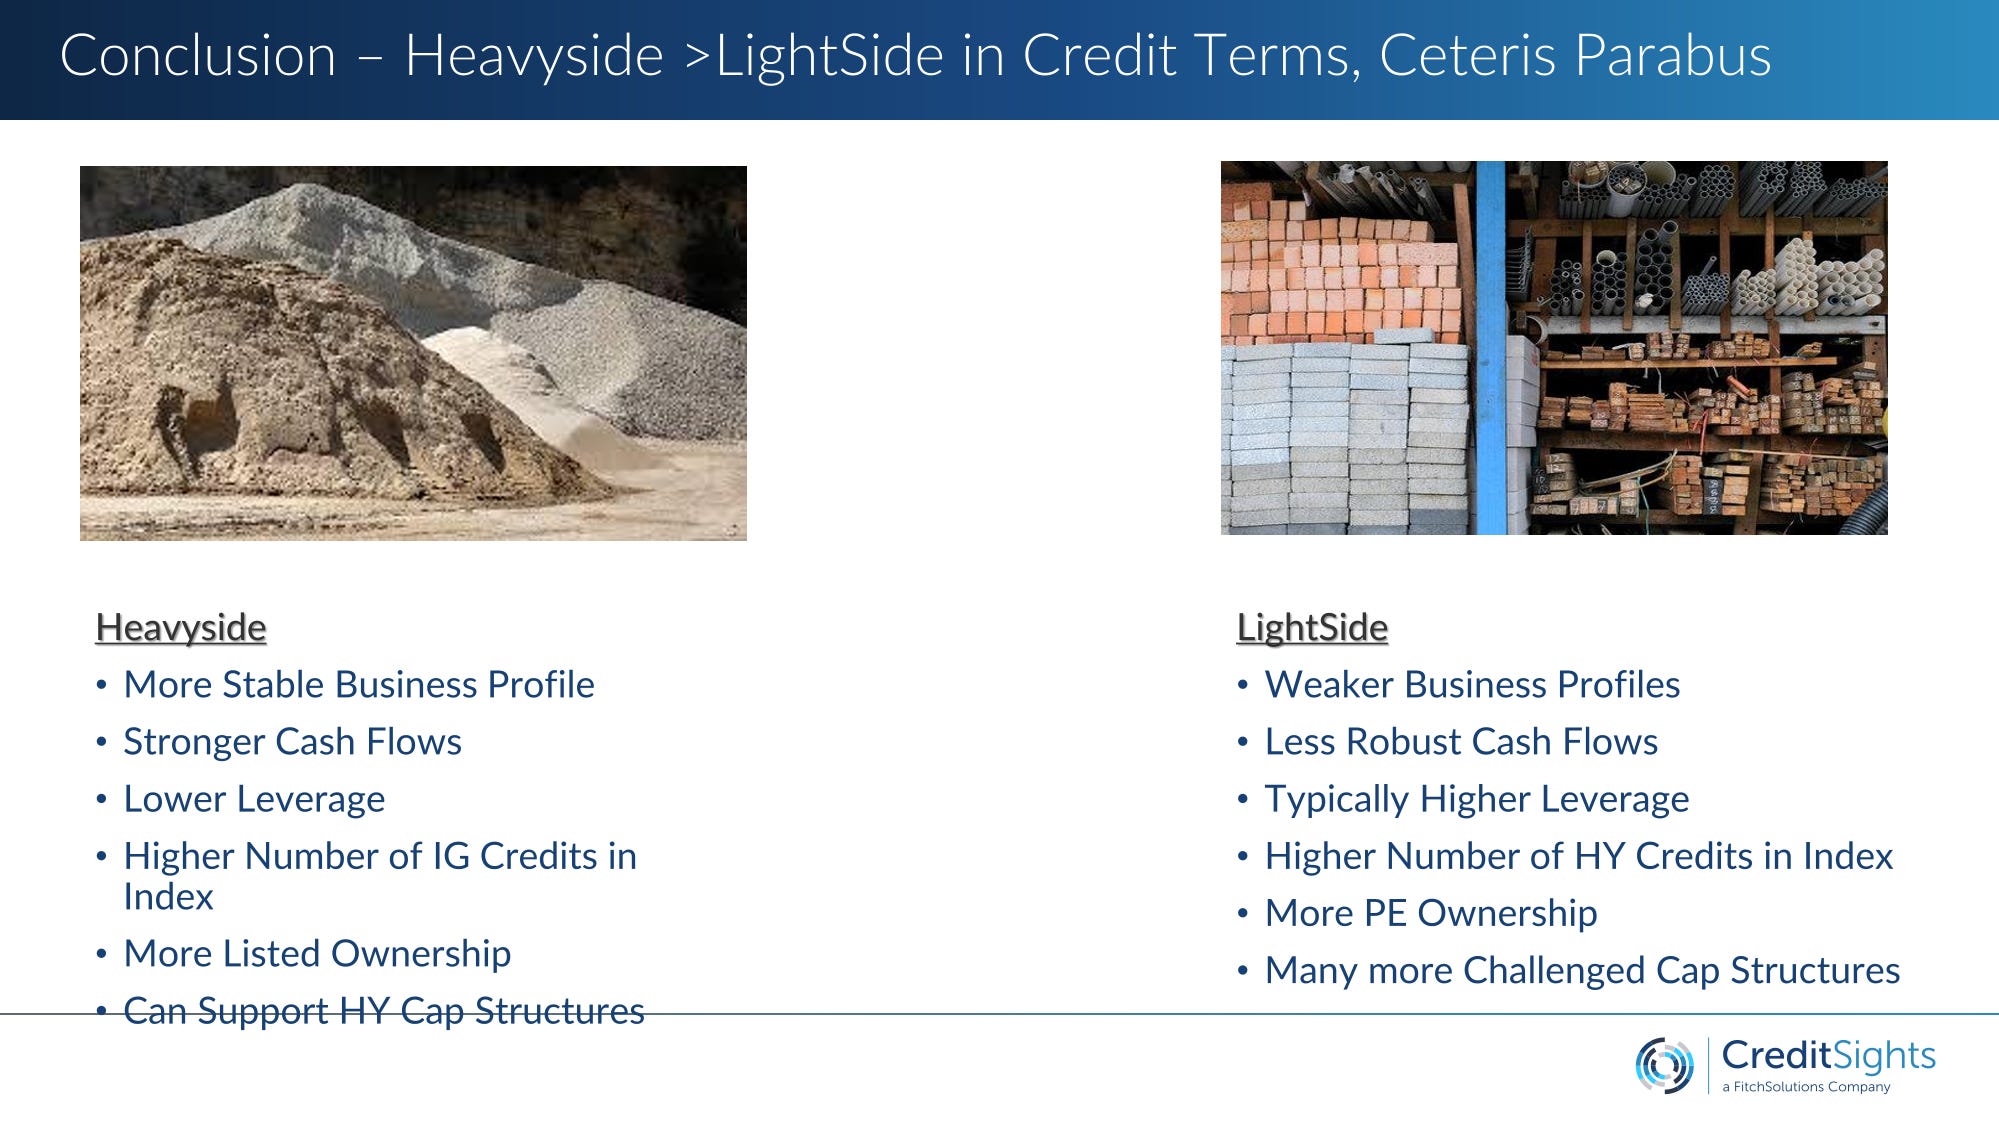
The heavyside/lightside distinction in building materials is usually presented as a product taxonomy — cement and aggregates on one side, windows and cabinets on the other. In credit terms, it is something more basic: a difference in how much protection you have when volumes move against you.
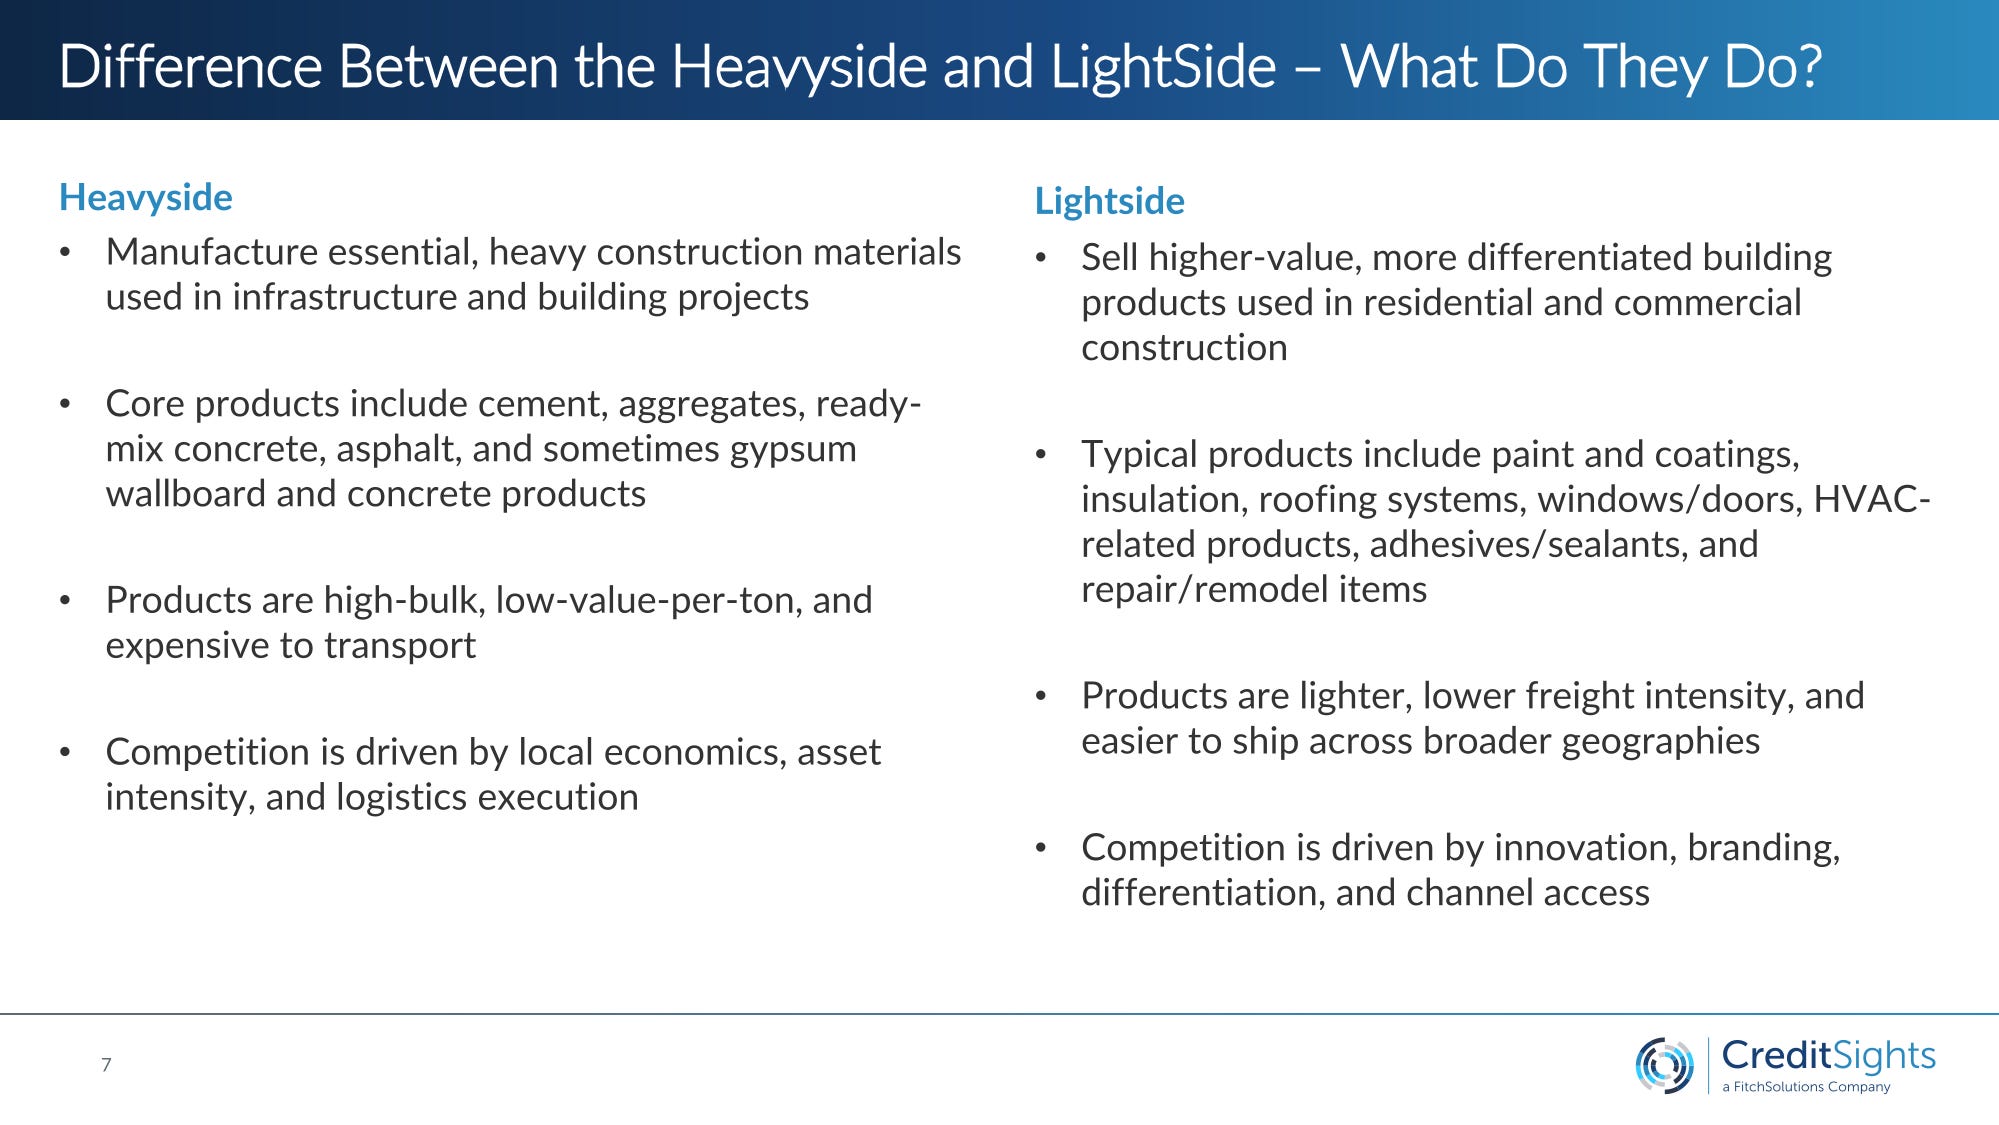
Heavyside: how the floor is built
What these businesses actually do.
Cement, aggregates, ready‑mix concrete, asphalt, and, in some definitions, gypsum wallboard and concrete products.
High‑bulk, low‑value‑per‑ton products that are expensive to transport; competition is local and logistics‑driven, not brand‑driven.
Why the market structure is so strong.
Each cement plant typically serves a limited regional market with only a handful of viable competitors.
Replicating a modern plant requires hundreds of millions to low billions in capex, plus quarry access, environmental approvals, zoning, logistics and energy infrastructure.
Permits in many US metro areas take ten to fifteen years — and in some markets are effectively unavailable.
How that translates into the credit floor.
Local oligopolies sustain rational pricing and steady market shares in all but the worst demand shocks.
Over the last twenty years, cement prices have compounded at roughly four to five percent annually; lumber, as a light‑side proxy, has managed one to three percent.
In distress, quarries and kilns trade as strategic infrastructure — scarce, difficult‑to‑replace assets with replacement value far above book — rather than as generic manufacturing capacity.
In Belton’s shorthand, heavyside assets are “local infrastructure monopolies with permitting moats, scarce resources, and sustainable pricing power.” The credit market has not always priced that combination as such.
Lightside: where the floor gives way
Business model in one line.
Windows, doors, cabinets, flooring, siding, insulation, roofing systems, interior finishes — diverse products, but a remarkably similar credit profile.
Three structural weaknesses.
Low barriers to entry: a windows or cabinets factory can be set up quickly and cheaply relative to a cement plant; capacity can be added in small increments, onshore or offshore, with much lighter permitting.
Weak bargaining position: large retailers and builder groups — Home Depot, Lowe’s and their European equivalents — control shelf space, specifications, and ordering terms. The manufacturer is usually a price taker into a concentrated channel, not a price maker into a fragmented contractor base.
Little hard‑asset protection: machinery is generic, many sites are leased, and there is no quarry‑style scarcity in distress. Once you move down the cap stack, there is very little that obviously forces lenders or buyers back to the table.
How that shows up in numbers.
Product lines run to five‑figure SKU counts; every SKU is open to substitution and downgrade when affordability bites.
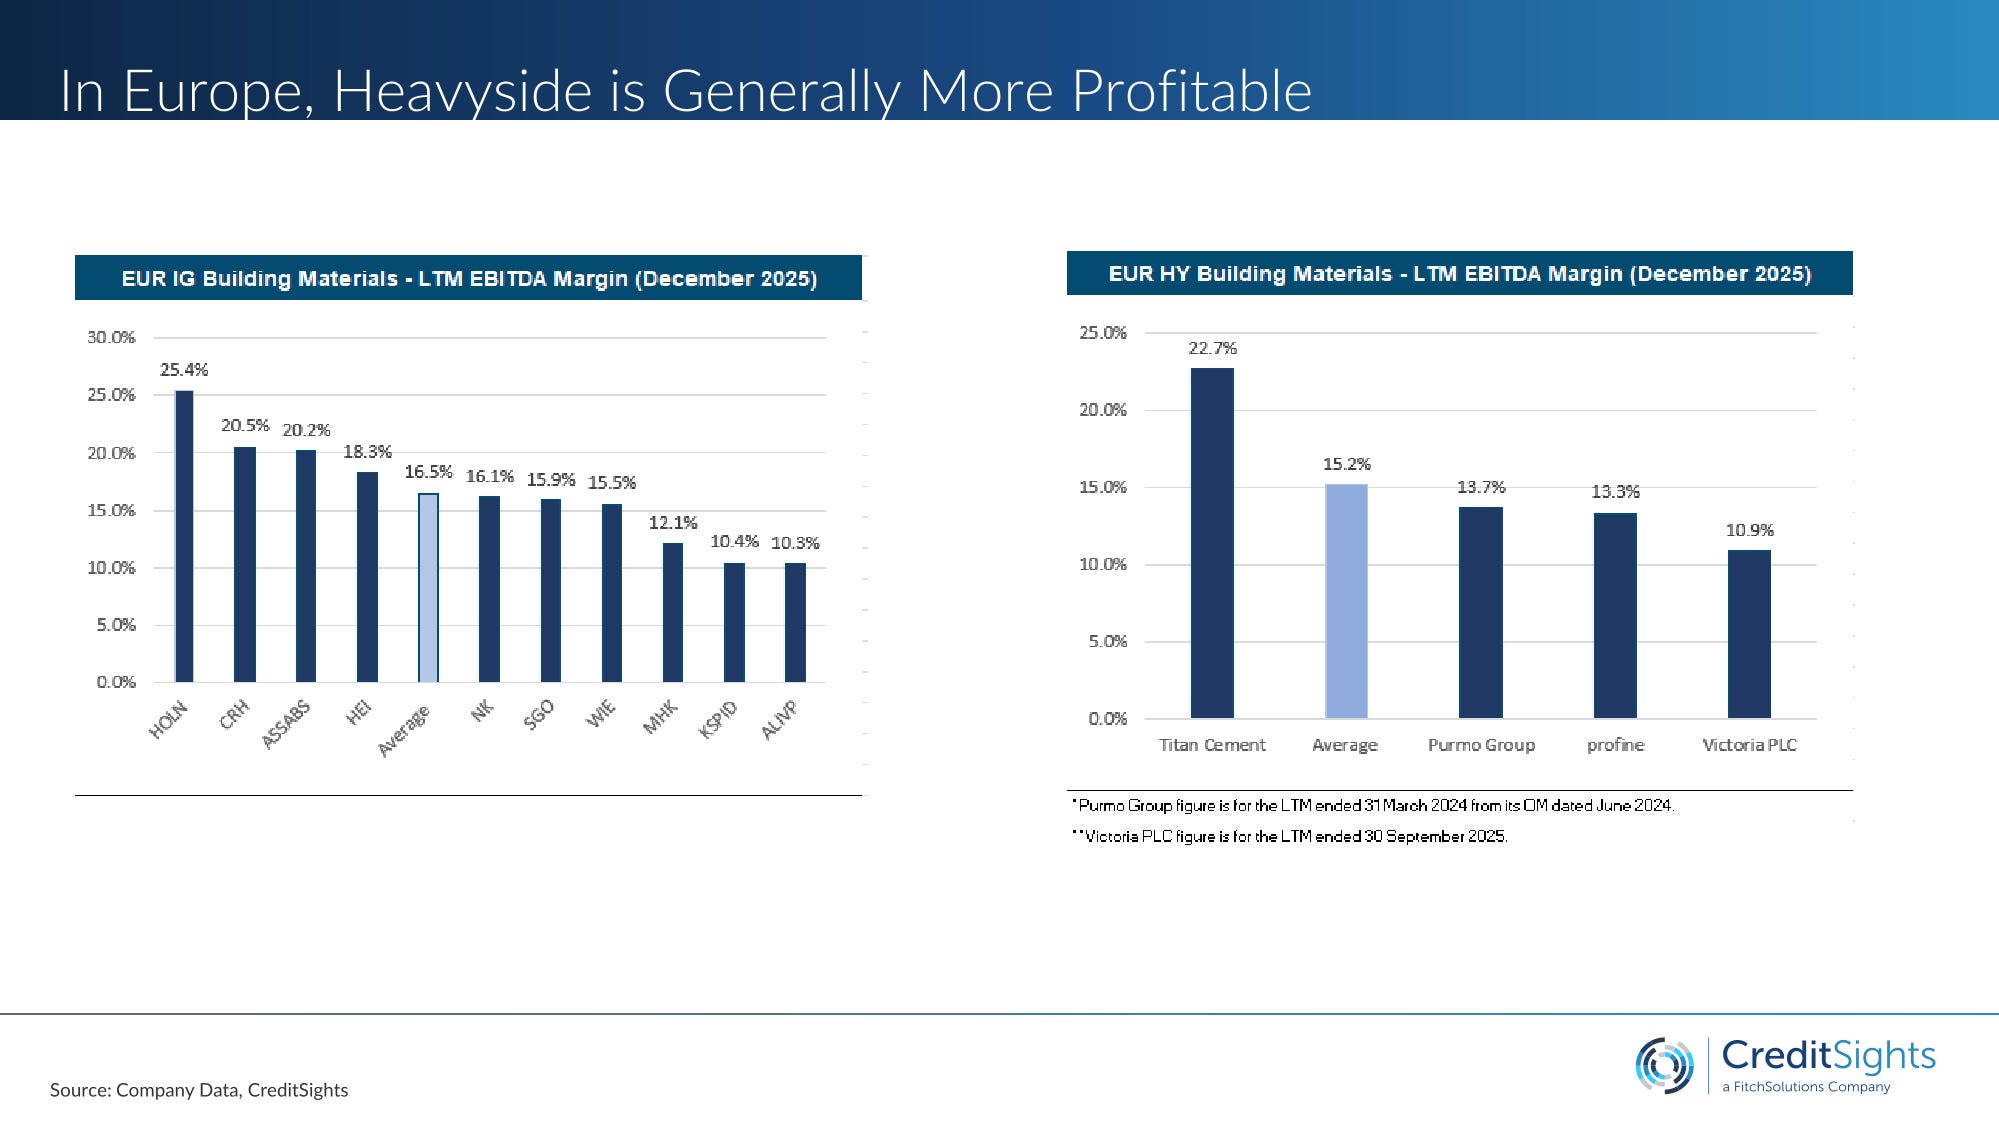
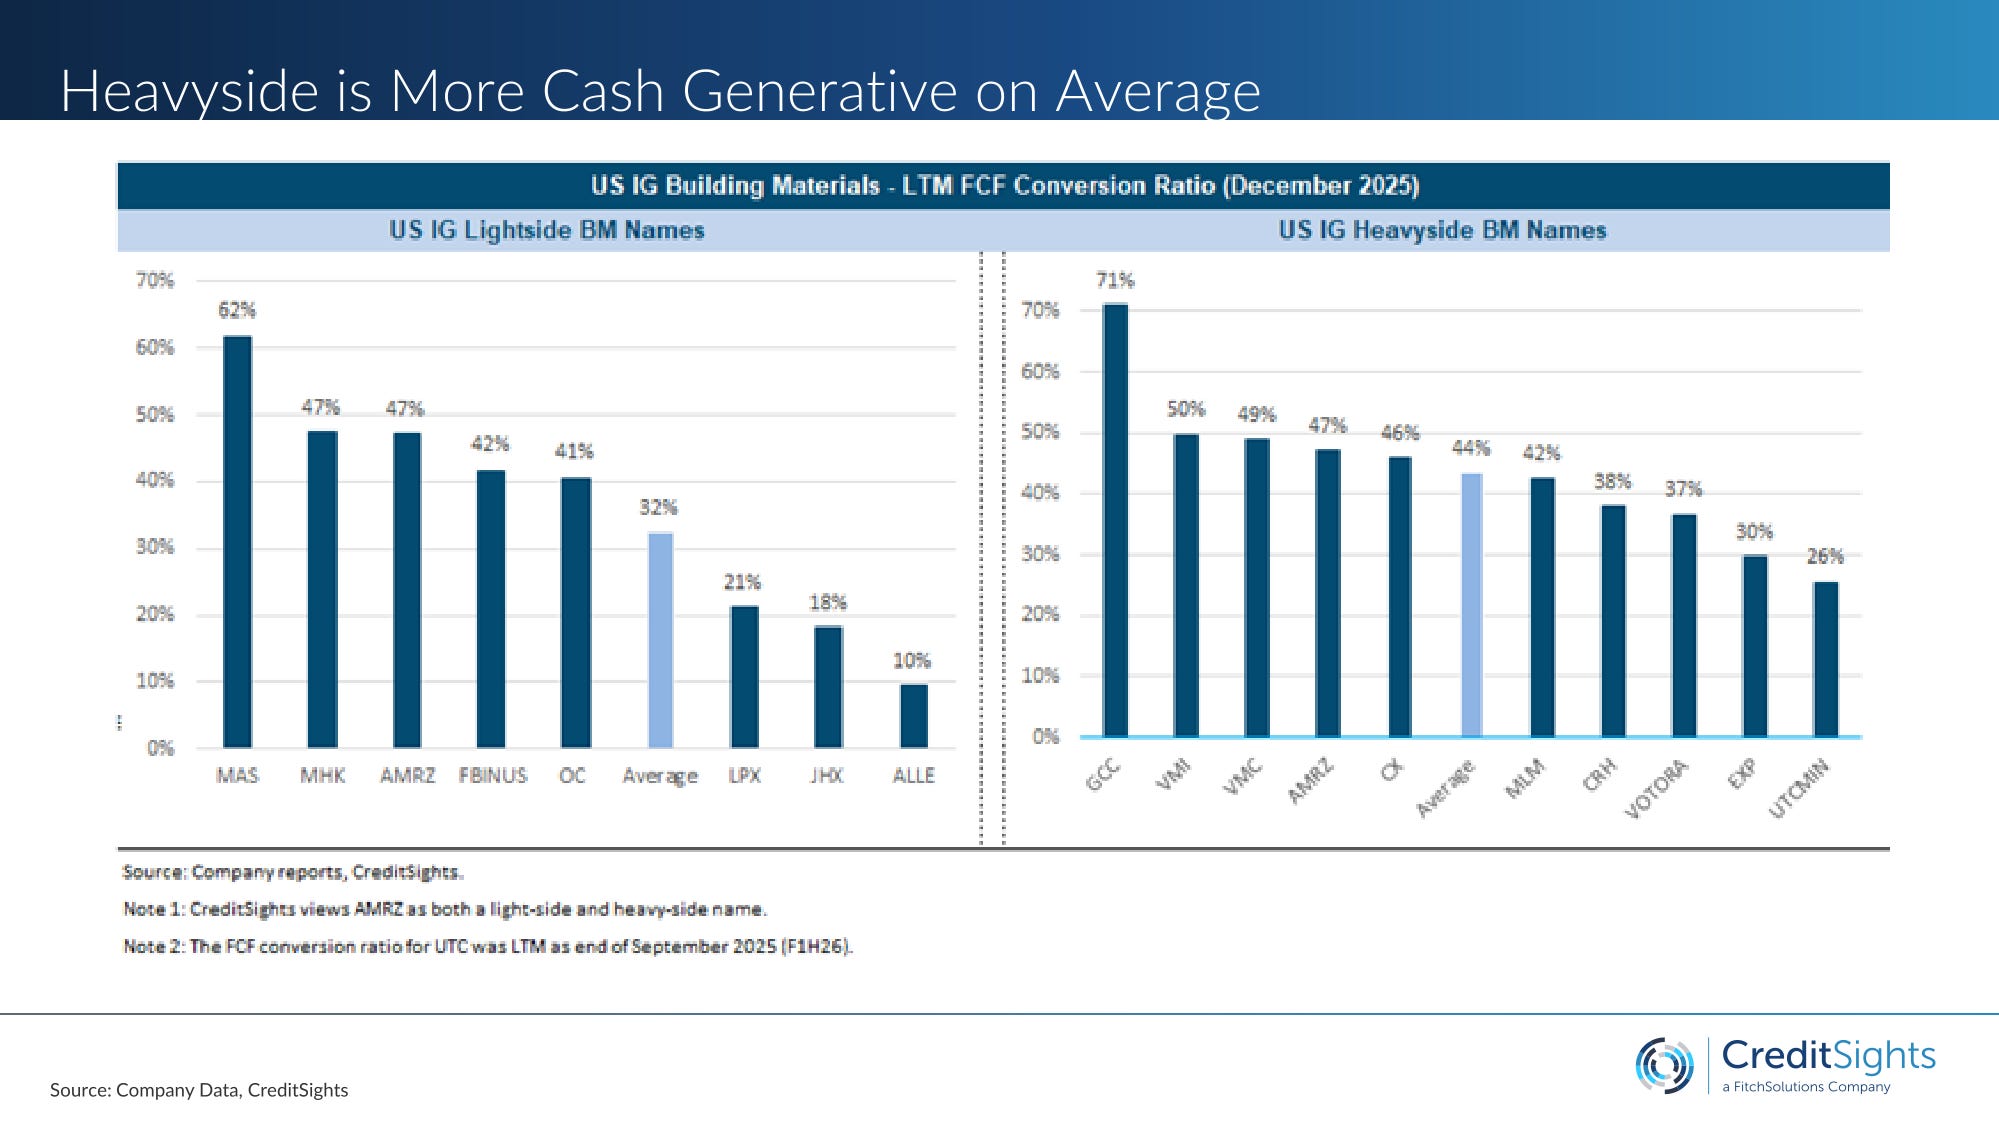
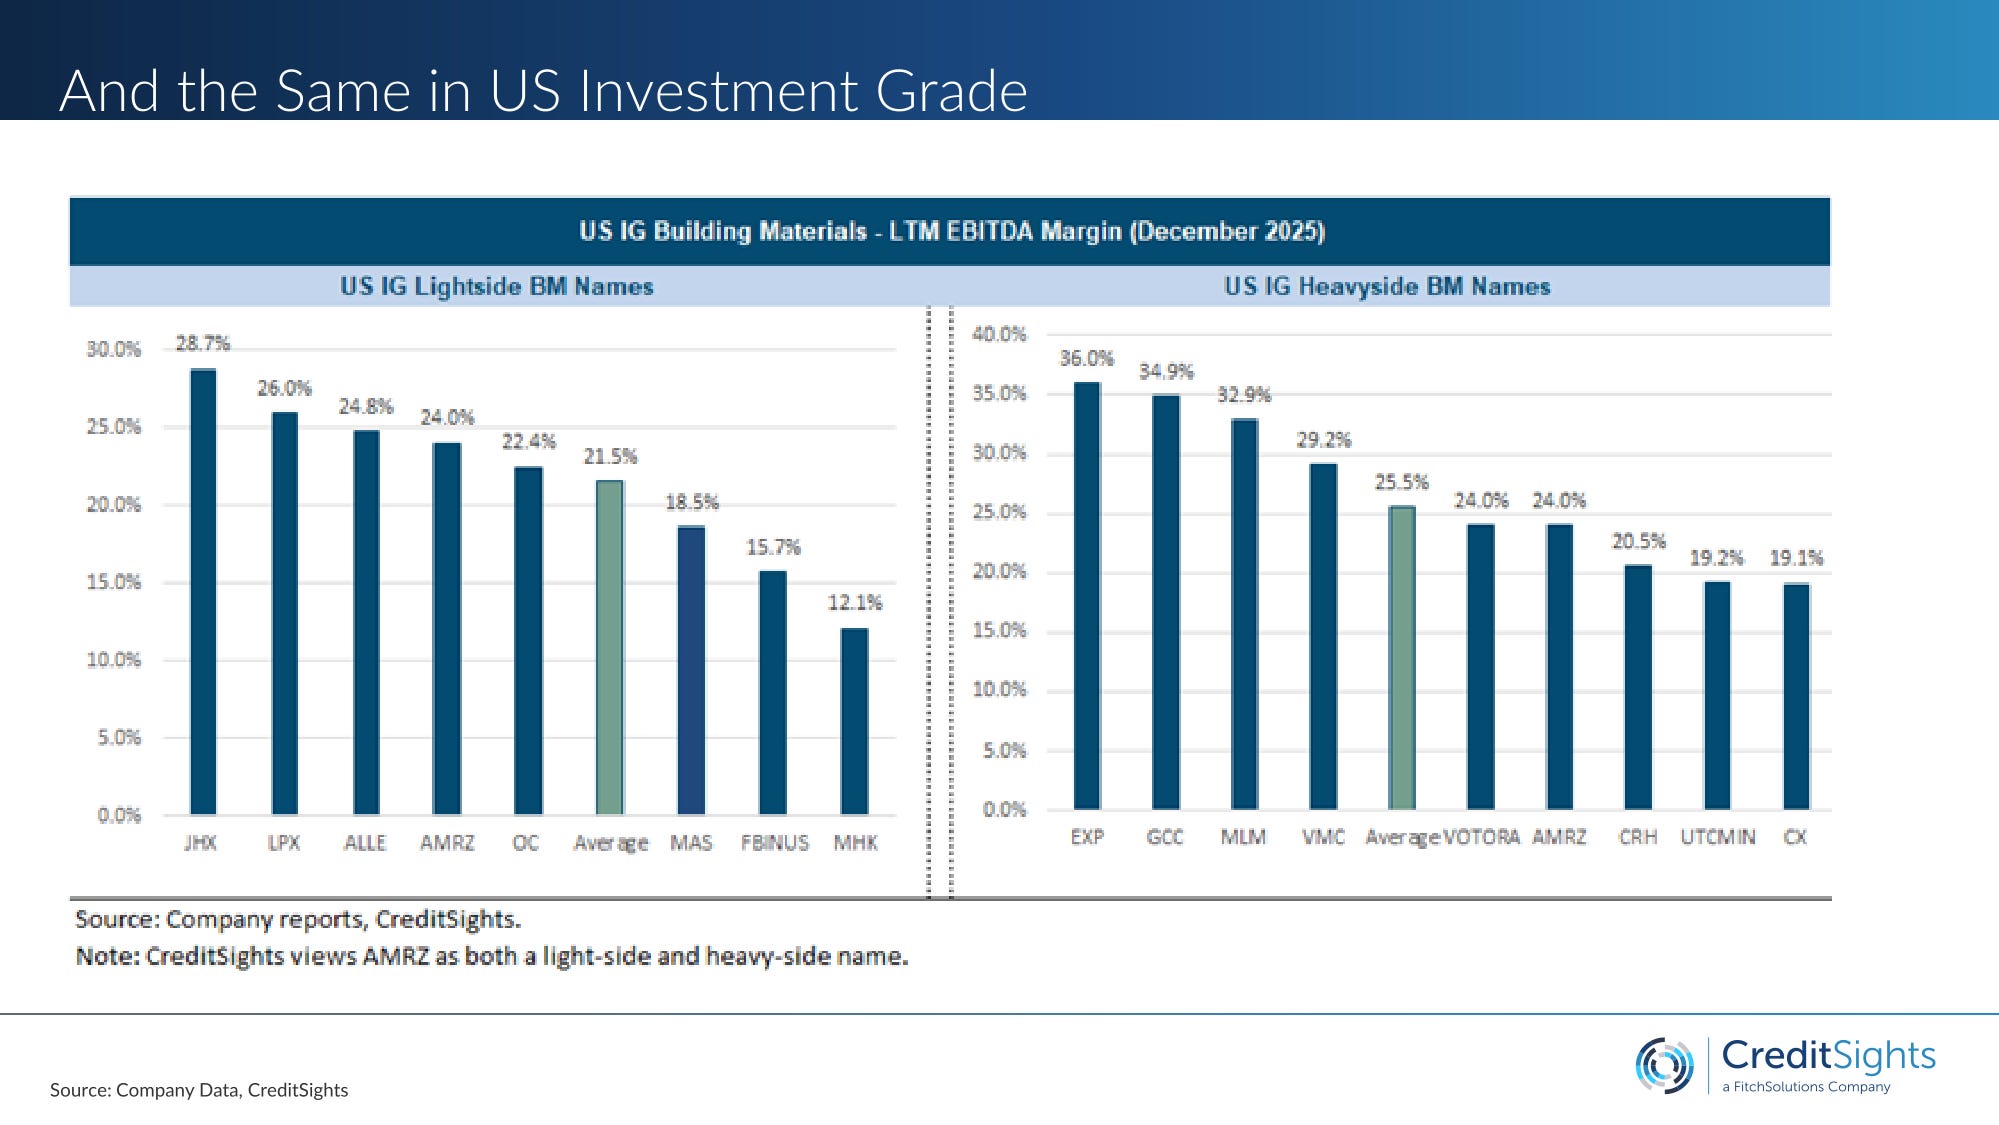
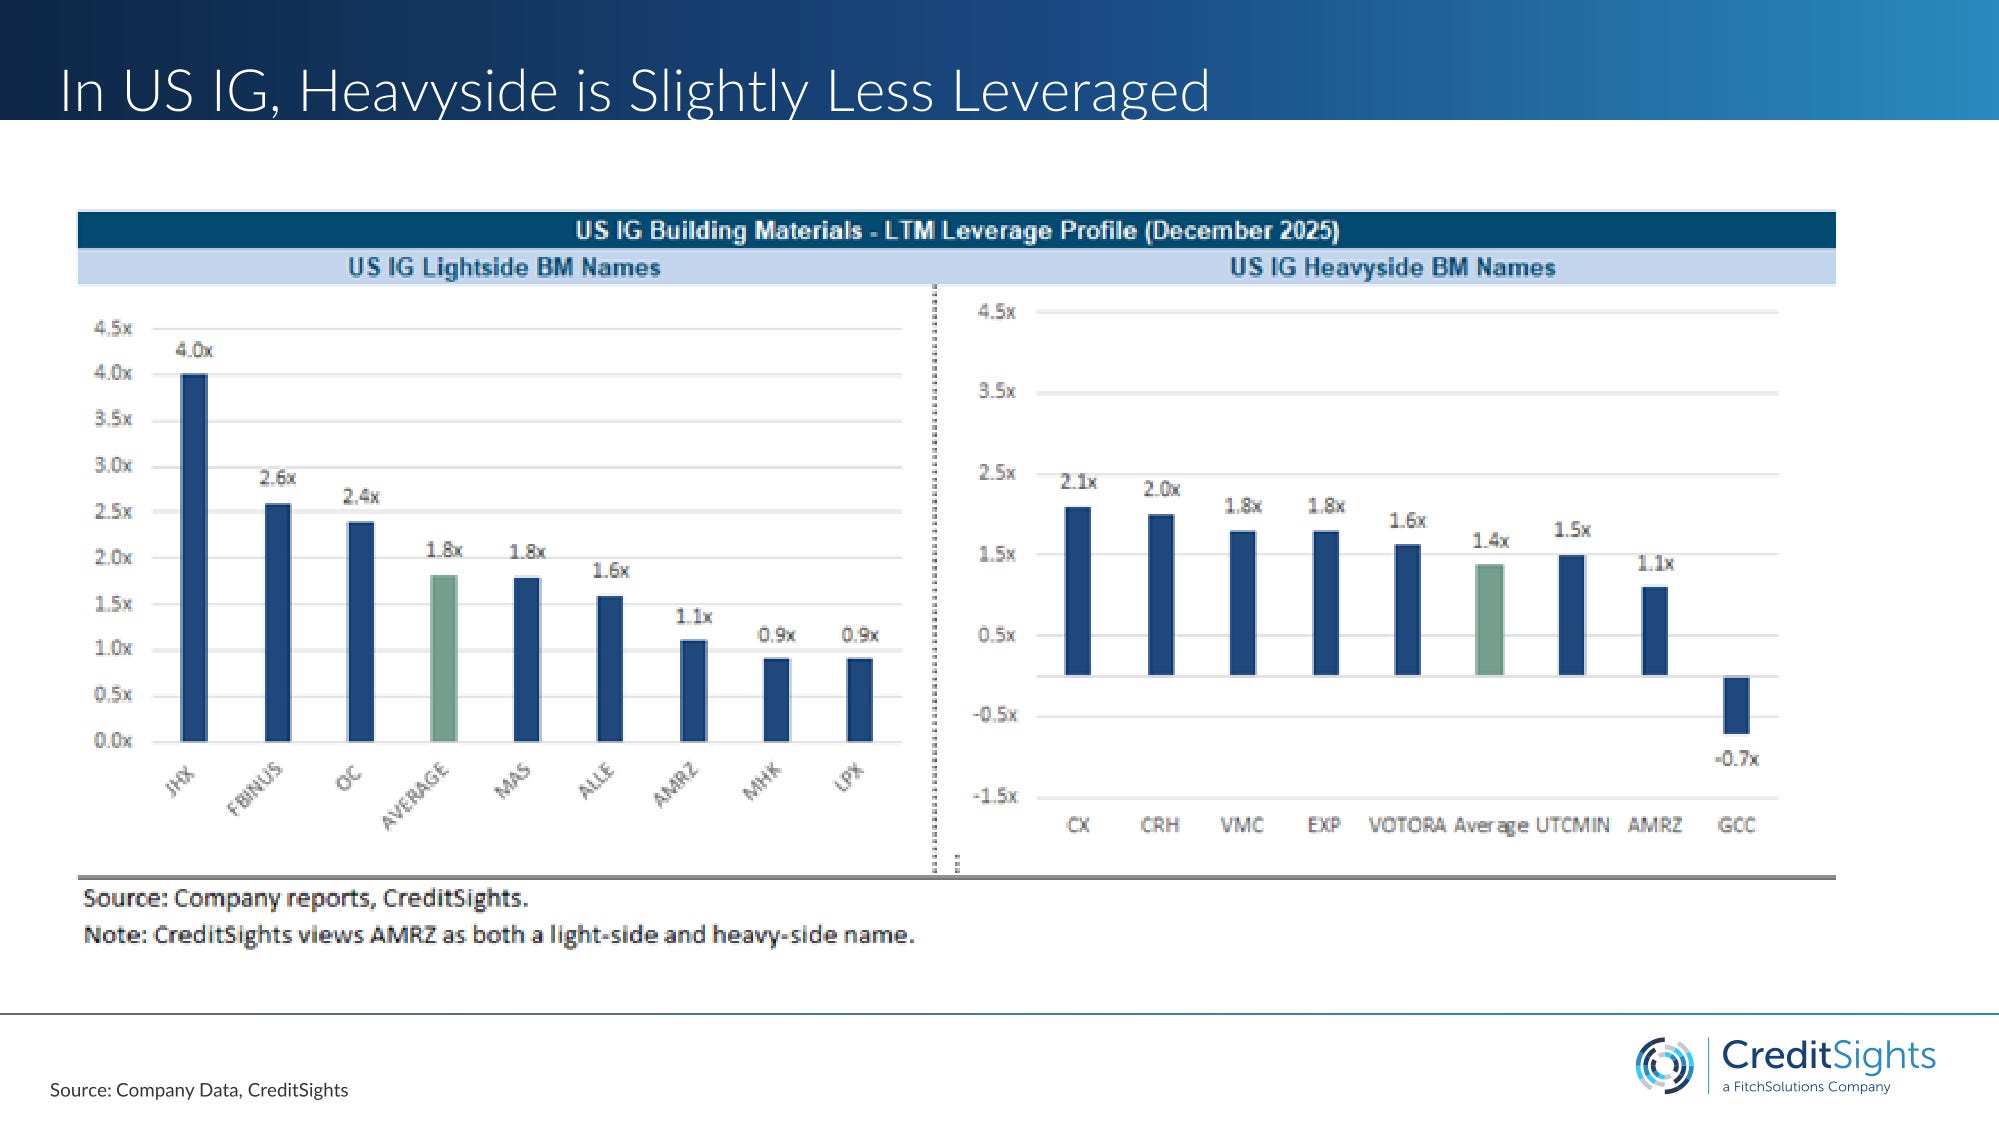
Even before you overlay ownership, CreditSights’ work shows heavy‑side producers earning higher margins, converting more of EBITDA to free cash flow, and running with lower leverage than lightside peers over one to two full cycles — roughly 26.6% vs. 20.9% EBITDA margins, 44% vs. 32% FCF/EBITDA, and 1.4x vs. 1.8x leverage in IG indices.
What this means for HY building products
At investment‑grade level, the pattern is clear: heavyside beats lightside on margins, cash generation, and leverage, in both US and European indices. At high‑yield level, it becomes a solvency question.
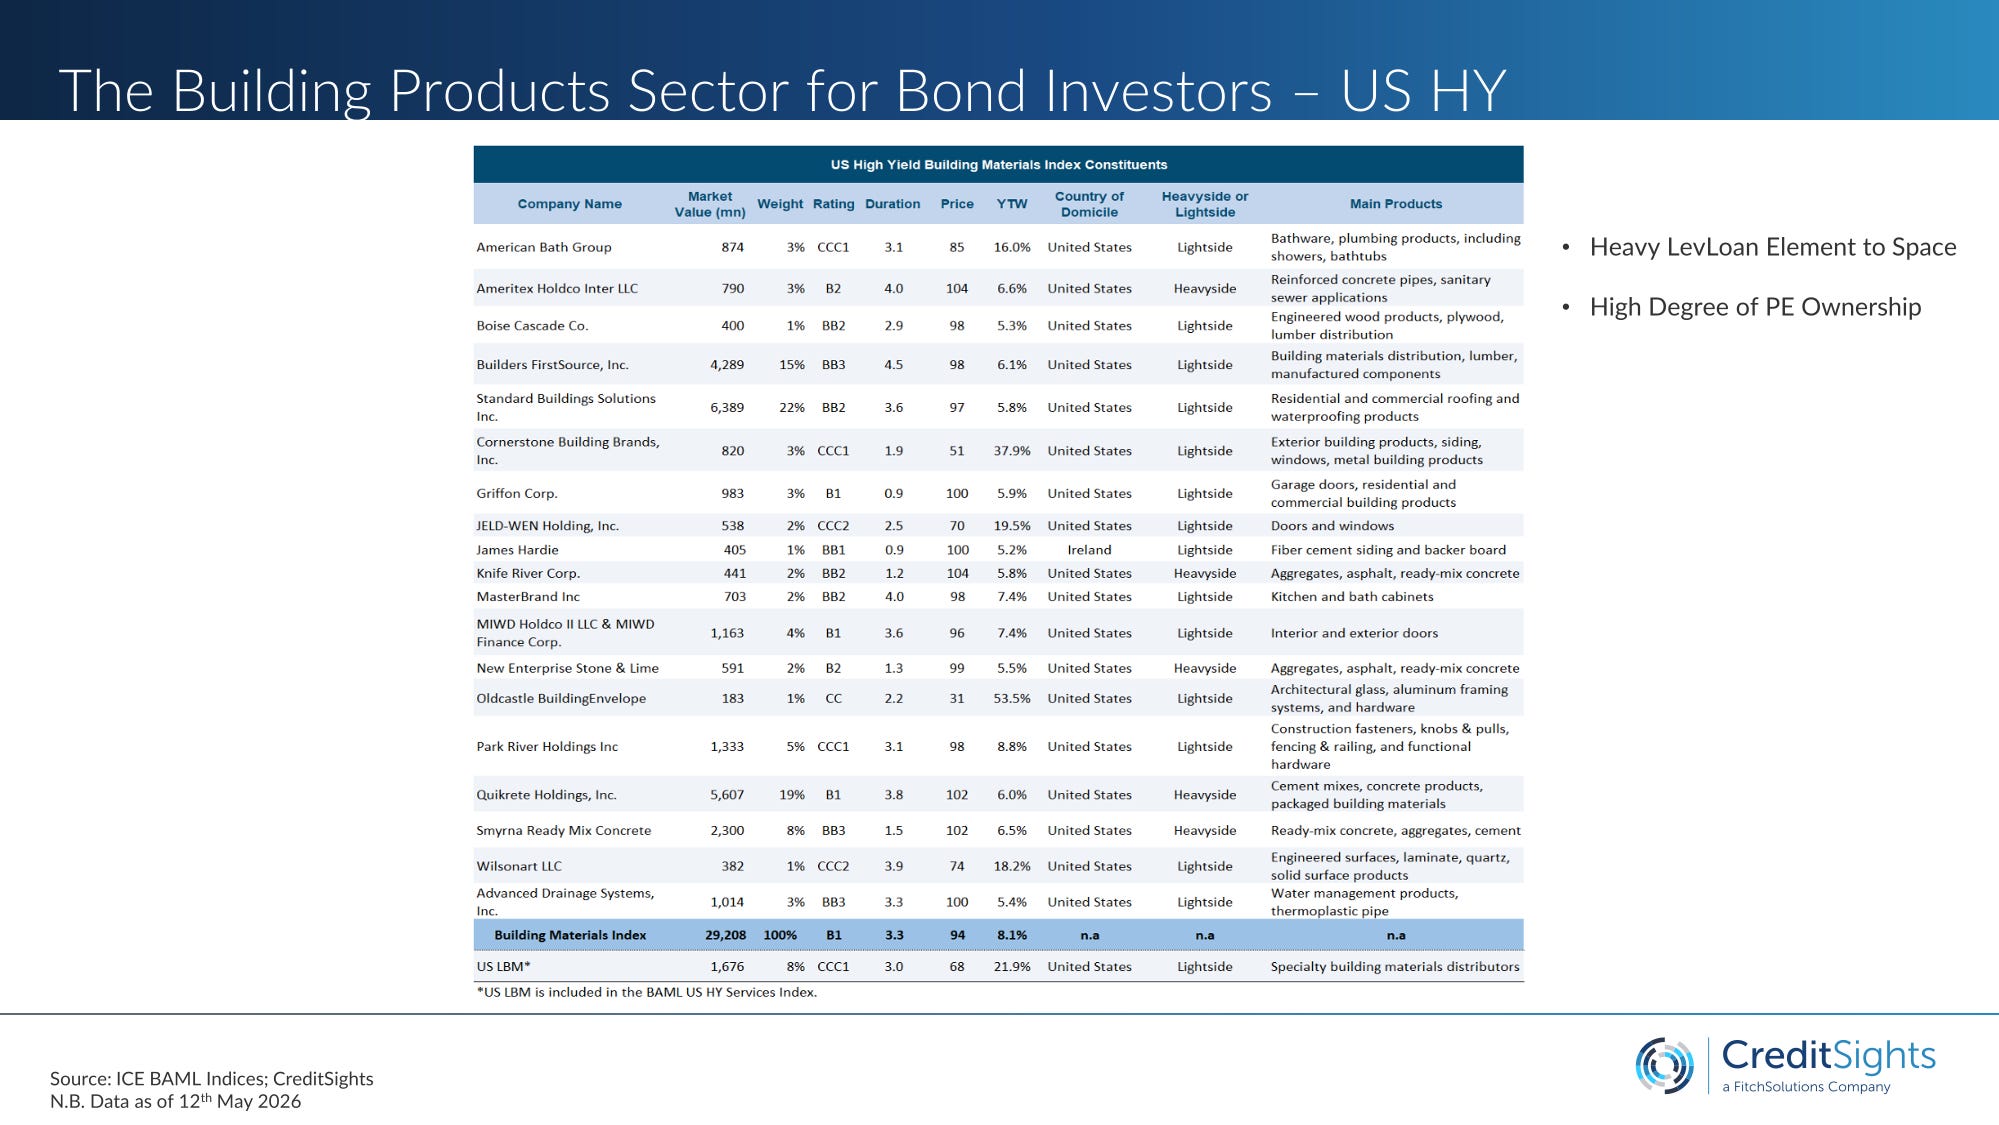
The US HY building products sleeve is “much more lightside‑focussed, and mostly lower‑margin,” dominated by businesses with low barriers to entry, weak bargaining power with retailers, and limited hard‑asset cover.
Layer private‑equity capital structures — nine‑times‑plus leverage sized at peak 2021–22 EBITDA — on top of that base, and you get exactly the pattern we see now: heavyside HY can “support HY cap structures”, light‑side HY produces stressed and distressed clusters when the cycle turns.
The McKinsey counter‑argument — that intra‑segment ROIC dispersion exceeds inter‑segment dispersion, so execution beats exposure — is not wrong for equity. But for credit, the question is not the ceiling; it is the floor. And the floor in lightside building materials, in a sector downturn, is structurally lower than the floor in heavyside — not because lightside companies are badly run, but because the economics and the asset base allow it.
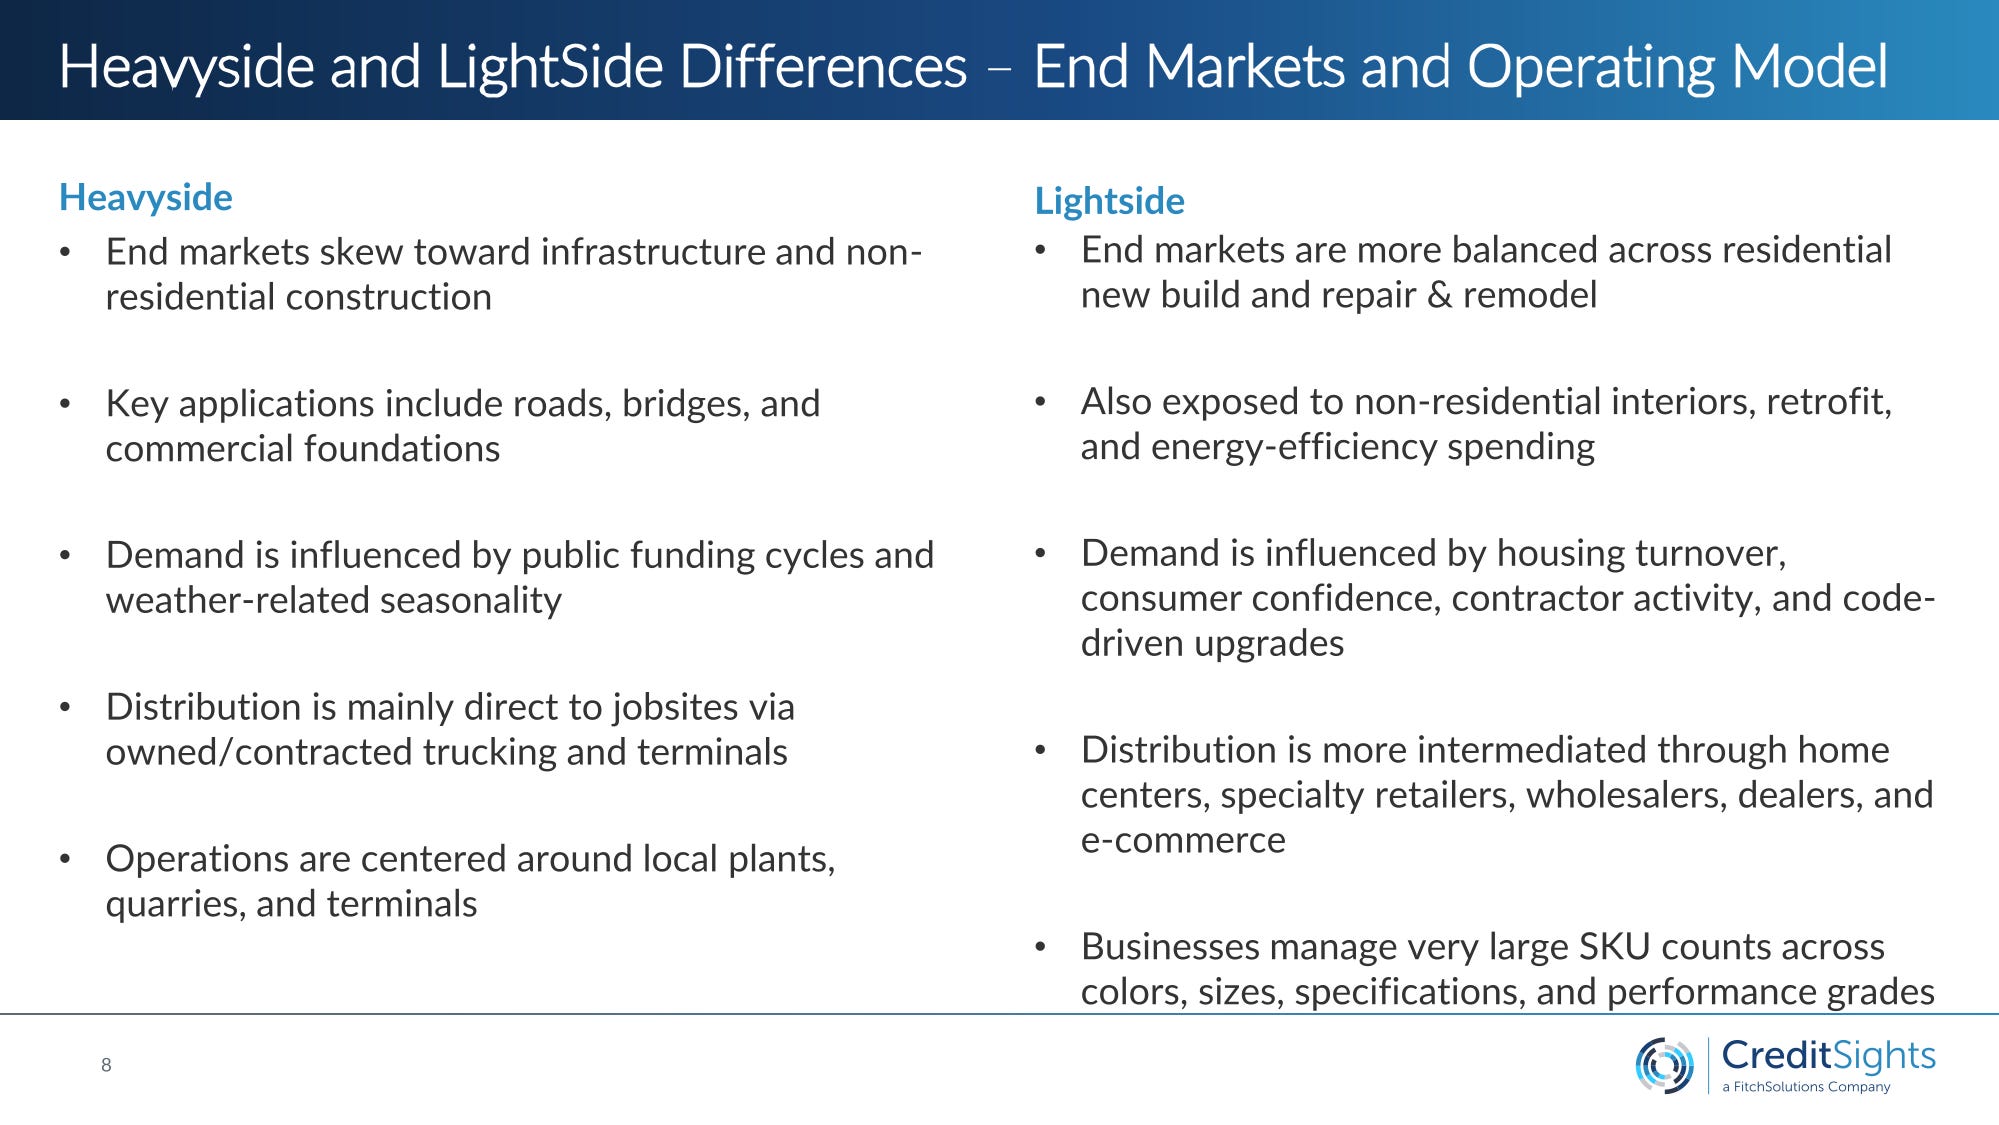
The Demand Picture: Volume, Pricing, and Where It Hurts
Between 2019 and 2022, the nominal revenue picture in building materials looked deceptively strong. COVID‑era household formation, stimulus, and migration drove a genuine demand surge in housing and R&R. Supply chains were tight. Pricing power was real. Top lines grew quickly, and the sector looked healthy.
Underneath, volume was already rolling over by 2022. Single‑family starts peaked in 2021 at around 1.13 million, then fell by 11% in 2022 and another six percent in 2023, before a brief seven percent rebound in 2024 that never fully rebuilt the pipeline. Total home starts have “ground steadily lower,” down three percent in 2022, eight percent in 2023, four percent in 2024, and one percent in 2025. Multi‑family followed a different, but equally volatile, profile. Upstream suppliers felt the boom and the bust more acutely than the builders, because their utilisation and fixed‑cost absorption moved one step earlier in the chain.
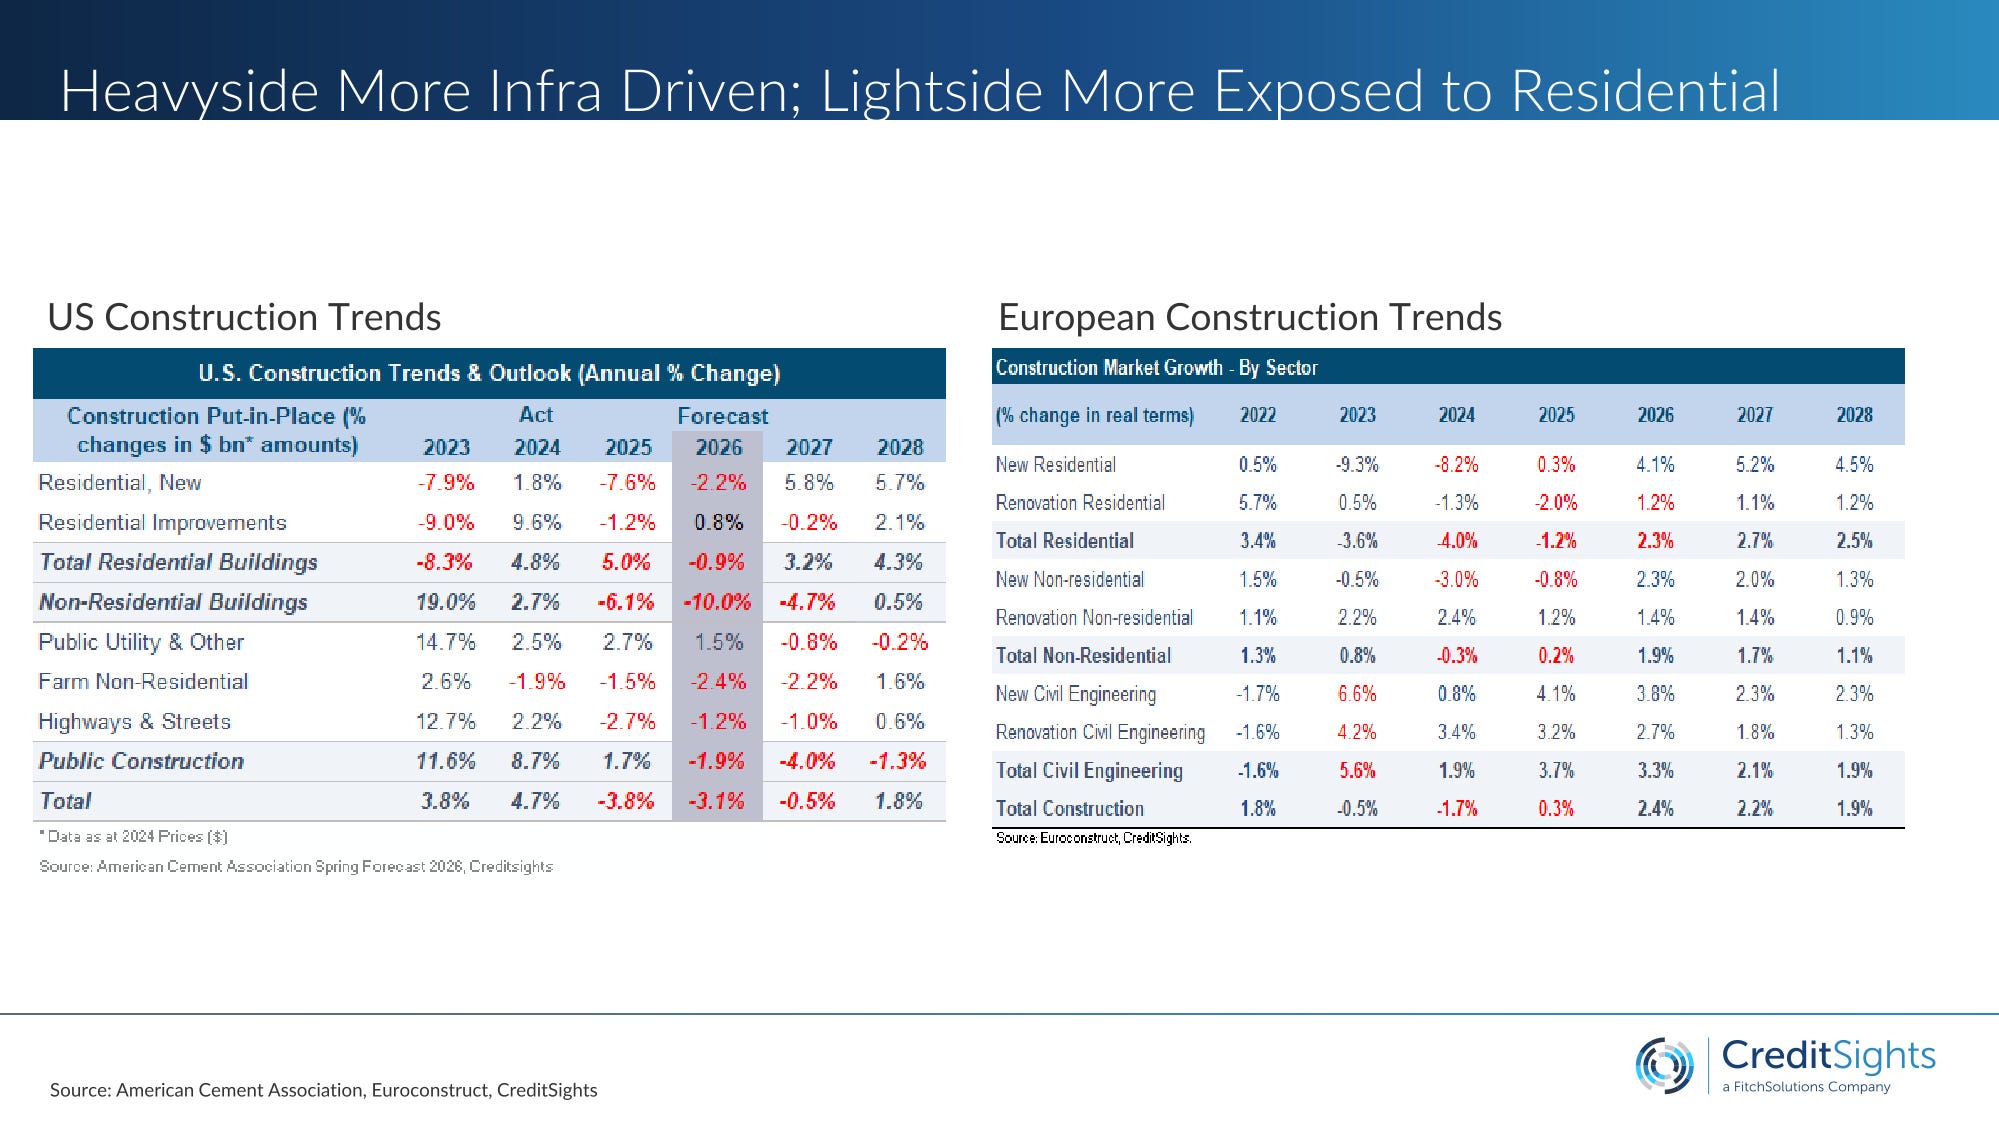
The ACA’s spring 2026 forecast has US real construction spending down three percent in 2026 after a four percent decline in 2025 — with non‑residential the weakest at minus eight percent in 2026, residential down just under two percent, and public/infrastructure down three percent. Residential is the number that matters most for lightside HY credits. A windows or cabinets plant is built around units moving through a system. When starts fall from 1.5 million to 1.1 million, factories lose throughput, fixed costs stop being theoretical, distributors destock, and EBITDA can unravel quickly.
Content per start helps at the margin — bigger houses, more premium finishes, higher‑spec glazing. But in a hard downturn, the premium specification thesis runs in reverse. Builders shrink kitchen footprints, remove islands, simplify bathroom layouts, and downgrade from semi‑custom to stock cabinets. A cabinet package that ran to 20–25 thousand dollars can be cut to 12–15 thousand. Window openings shrink, architectural shapes disappear, glazing specifications are simplified, and frame quality is reduced. Doors can be standardised and cheapened. Sidings see less mix pressure, because the envelope still has to exist, but even there builders can move from fibre cement to vinyl, remove stone veneer, and simplify trim. Insulation is the relative outlier: building codes and energy standards make deep downgrades difficult, so it behaves more like a quasi‑heavyside category.
The R&R market is the other potential release valve. On paper, the fundamentals are excellent: a median US home age of around forty years, roughly 300 thousand dollars of homeowner equity, and mortgage lock‑in keeping people in existing houses longer. In practice, R&R is highly sensitive to psychology and financing costs. Homeowners may have equity and a kitchen in need of replacement, but high contractor quotes, floating rates on HELOCs, and a background of economic and geopolitical uncertainty are enough to stall projects. Fixed‑rate second‑lien mortgages — which let homeowners preserve ultra‑low first‑lien mortgages while financing renovation with payment certainty — could unlock the next leg if rates drift structurally lower. Until then, R&R looks more like a sideways market than a cycle‑saver.
On the heavyside, the same macro environment looks less dramatic. Aggregates and cement pricing have remained strong despite negative real growth in construction, with aggregates up four to seven percent, cement flat to modestly up, and ready‑mix and asphalt broadly positive. Vulcan reported a 3.5% rise in volumes in Q1 2026; Martin Marietta reported thirteen percent, both guiding for low‑single‑digit volume growth and three to four percent price inflation for the year. Public construction’s apparent three percent real decline is as much a denominator story — inflation in construction spending includes materials costs — as it is a demand story. For the heavyside IG names selling into infrastructure, that inflation is a revenue benefit, not a problem.
One Trade in Disguise: The HY Index
At index level, the US HY building products segment is not ten different trades; it is one housing bet dressed up as diversification.
The anatomy is straightforward. On the lightside, you have windows, cabinets, roofing, flooring, siding, and building products distributors — nominally distinct businesses with different SKUs, customer relationships, and operating histories. On the macro side, you have a small set of drivers: housing starts, mortgage rates, affordability, R&R spending, and dealer inventory cycles. In good markets, investors can focus on company‑specific execution, operational improvement, and idiosyncratic positioning. In a downturn, the correlations spike and the sector trades as leveraged housing beta.
“I am increasingly viewing the high‑yield building products market in the States as essentially a leverage play on the US housing cycle, disguised as effectively a diversified quasi‑industrial index.”
Private equity ownership is not an incidental detail here; it is a structural feature. Lightside businesses are easier to buy, easier to consolidate, easier to “improve” on visible metrics, and less capital‑intensive than heavyside quarries and kilns. The US HY building products snapshot in Belton’s deck carries two flags in bold on the lightside side of the ledger — “Heavy LevLoan Element to Space” and “High Degree of PE Ownership.” In practice, that means light‑side HY investors are not just underwriting operating risk; they are underwriting sponsor behaviour, covenant flexibility, and the willingness to use liability‑management tools when the numbers do not add up.
The floating‑rate loan market has been the first place this showed up. As the Fed’s hiking cycle from 2022 onward repriced interest expense almost immediately, coverage ratios in cov‑lite structures compressed long before maturities became an issue. The bond market, with fixed coupons, enjoyed a temporary insulation; that insulation is now disappearing as the 2027–2029 maturity wall moves into view and operating performance remains under pressure. CLO tolerance for amend‑and‑extend, incremental facilities, and other forms of maturity‑wall engineering has kept some of the weakest names alive longer than a traditional cycle would have, but it has not solved the underlying problem.
The Anatomy of Distress: JELD‑WEN and the Lightside Model
JELD‑WEN is a useful specimen of what is going wrong on the lightside, precisely because it is not a cartoon villain. It is a broadly representative business, with real scale, and its problems line up closely with the structural weaknesses of the model.
The portfolio is about two‑thirds doors, around nineteen percent windows, and the rest other building products, with a meaningful European footprint accounting for roughly a third of revenues. End‑market exposure is around 87% residential, split between roughly half new construction and just over forty percent R&R, with thirteen percent non‑residential. The revenue base is concentrated: the top ten customers account for about half of sales; Home Depot and Lowe’s together represent around thirty percent, and Home Depot alone roughly seventeen.
In credit terms, that is a highly levered price taker into a concentrated channel, not a price maker into a fragmented contractor base. When volumes fall and the company attempts to push price to offset cost inflation, it is pushing into two retailers who can — and do — use their bargaining power on pricing, service standards, shelf space, and ordering terms. When operations are under strain, service slips; when service slips, volumes can be lost quickly to alternative suppliers or to destocking decisions made at the retailer.
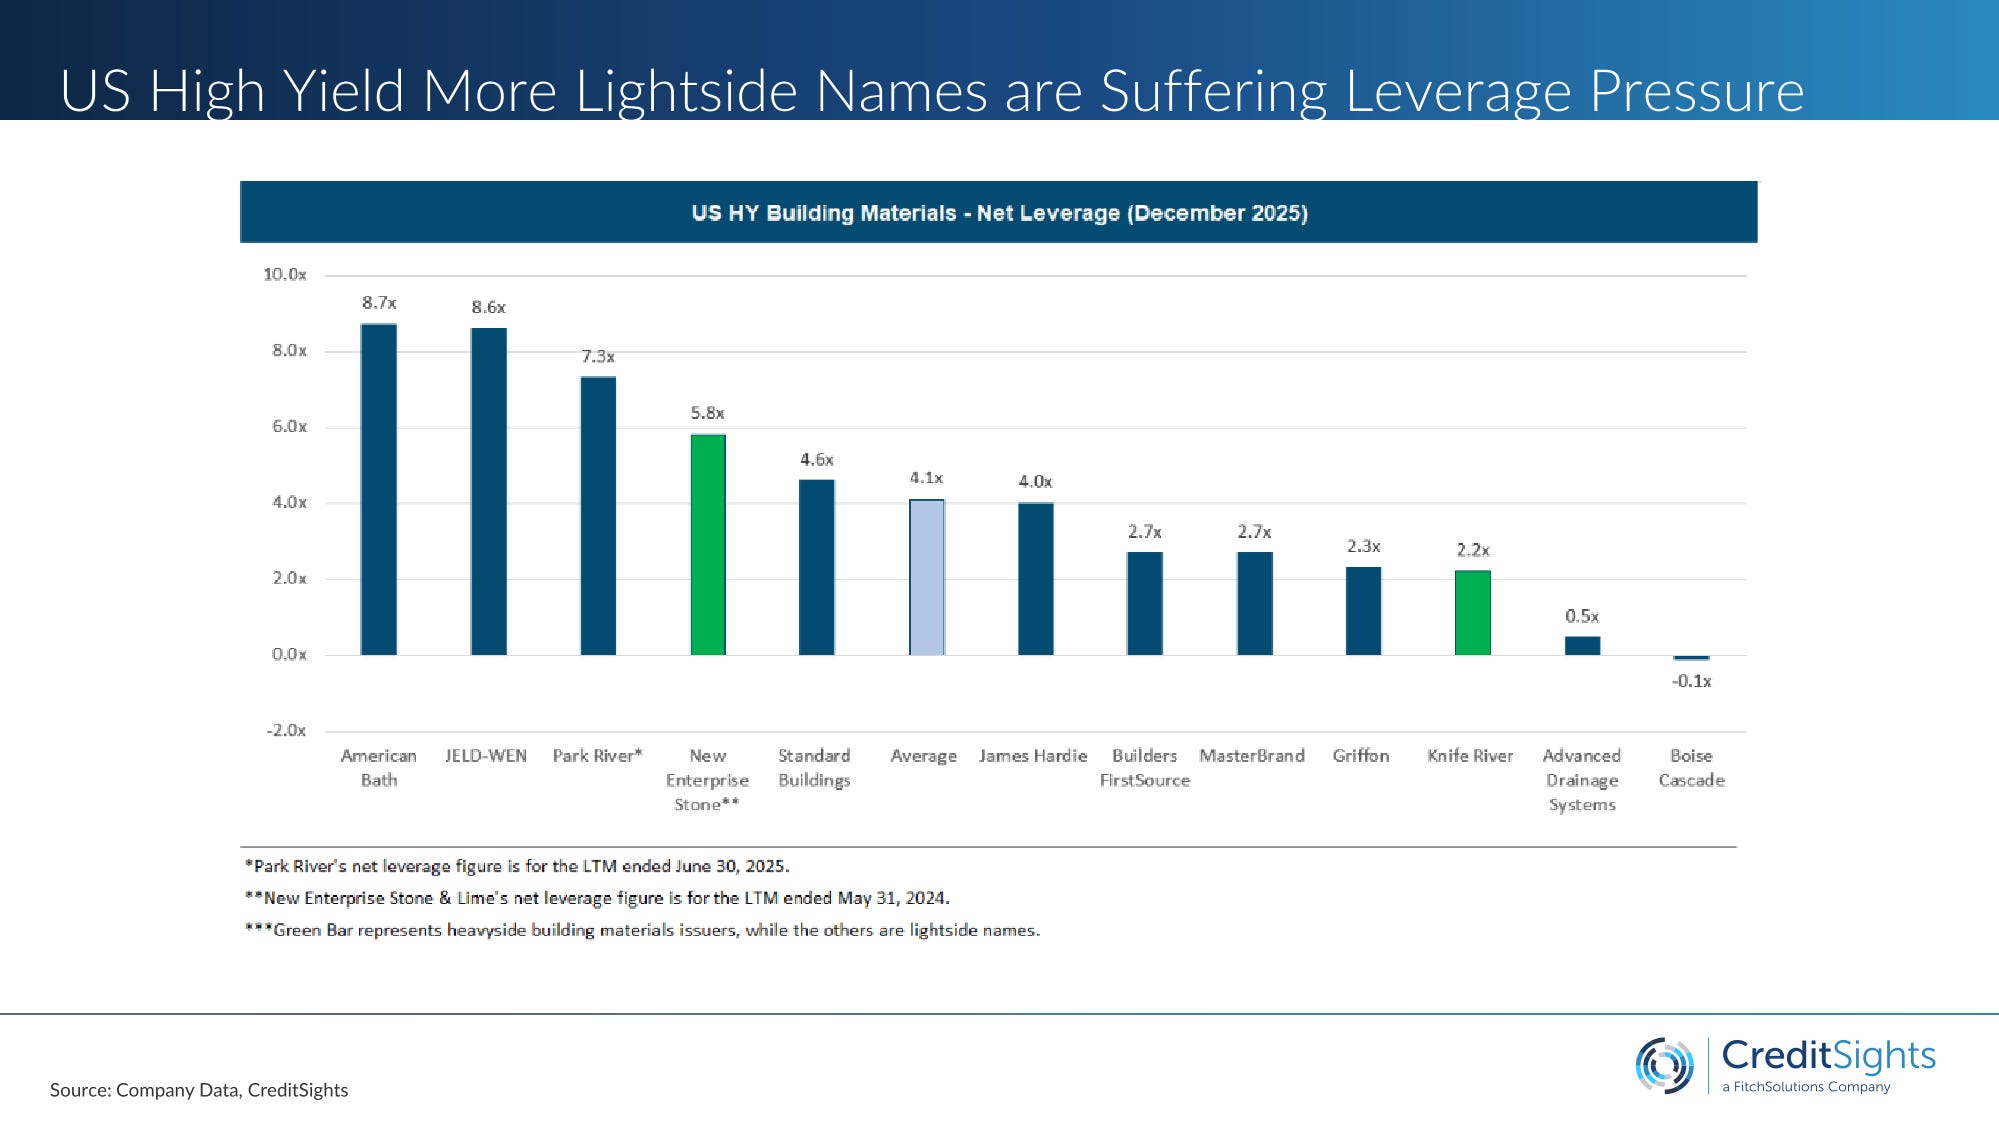
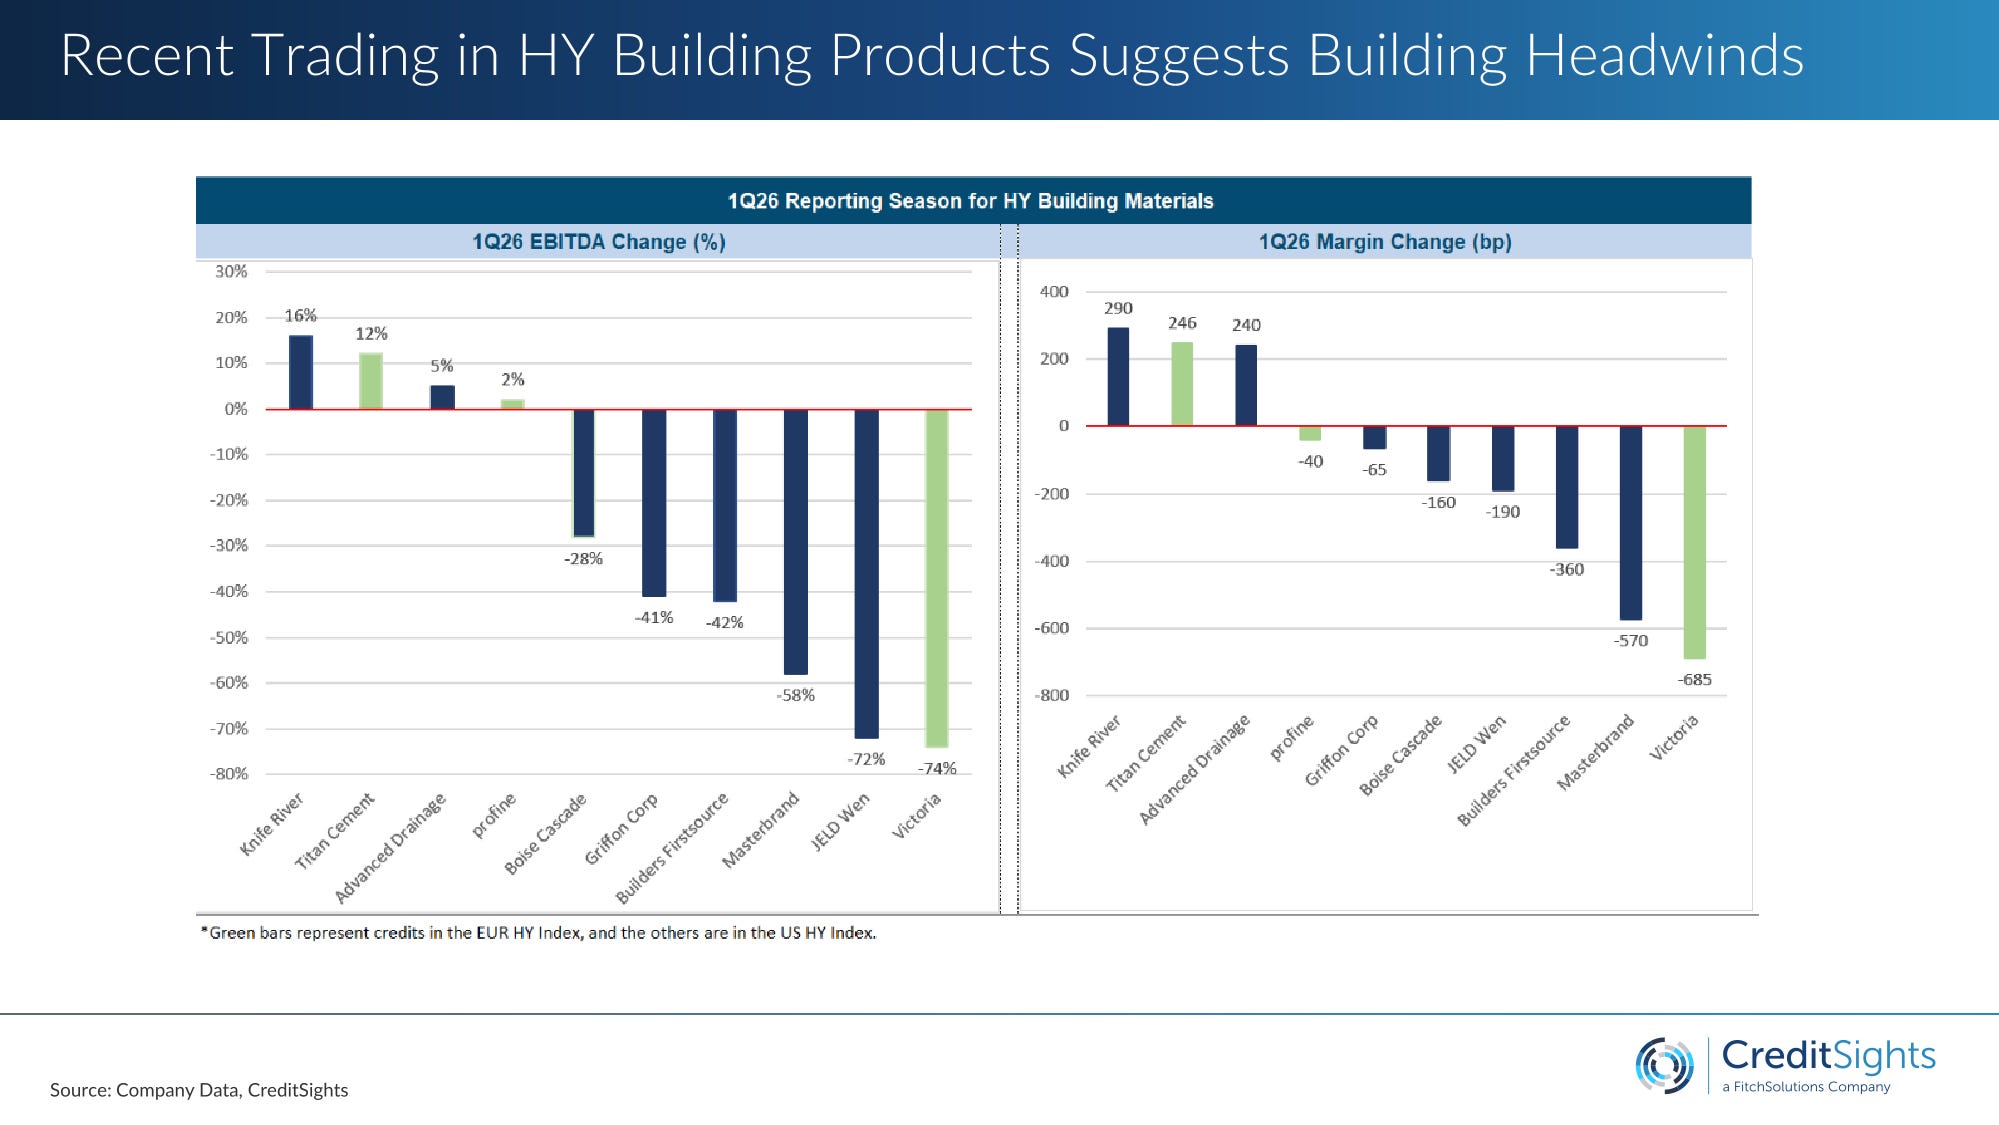
The current numbers capture that spiral. American core revenue was down roughly fourteen percent year‑on‑year in the first quarter, driven by a thirteen percent volume and mix decline and a one percent price decline. The business is tracking both new construction weakness and R&R softness at the same time. EBITDA margins have compressed towards four percent, a long way below Belton’s “steady‑state” high‑single‑digit view for a business with this positioning and customer concentration, and further still from the mid‑teens margins better‑placed building products names can sustain. Leverage sits around nine times.
The capital‑structure pressure point is the December 2027 unsecured maturity, which goes current in December 2026. The term loan is higher in the stack and has collateral; it trades in the low‑to‑mid‑90s. The unsecureds, reflecting the maturity wall and the low probability of a vanilla refi at nine times leverage on four‑percent margins, sit in the 70s. In practice, they are already being treated as the shock absorber for whatever liability‑management exercise comes next.
There is optionality in the European business: a disposal at a decent multiple could provide some deleveraging and runway, even if it does not fully solve the operating problem. But assets sold under stress rarely clear at the multiples needed to transform the balance sheet, and every quarter of weak performance erodes bargaining power. Belton’s base case is not an immediate US‑style court process, but a bond‑focused liability management exercise built around the unsecured notes. If North America does not stabilise and the European option is not realised, a broader restructuring remains possible, but the window narrows as the “current” date approaches.
The European Parallel: Pfleiderer and Silekol
The story that makes JELD‑WEN feel uniquely American — cov‑lite loans, LMEs, and sponsor engineering — looks less exceptional once you look at Pfleiderer.
The company — a German wood‑panels manufacturer that had already restructured once — executed a drop‑down in December 2025 that moved its Silekol adhesives business outside the restricted group, selling ninety percent of the equity into newly created unrestricted subsidiaries. Around 110 million euro of new debt was raised by Monarch and 25 million by SVP, secured on the Silekol shares. The new money sits structurally senior to the existing bonds; the guarantees and collateral that Silekol had provided to the notes fall away. What is left in the restricted group is a weaker asset base and a subordinated bond stack — and a schedule of maturities and covenants that now have to be negotiated from a position of reduced collateral coverage.
The twist is that this was done in an ostensibly “cleaned‑up” post‑restructuring document. Covenant tightening in the prior process — priming caps, investment limits — was supposed to prevent exactly this kind of structure. Instead, the company appears to have used an asset‑sale path to bypass those tighter limits. The lesson for European HY is simple: if you still believe you are in a fundamentally more consensual, less aggressive covenant environment than US HY, you are underwriting a regime that is fading quickly.
The most exposed cluster is not the CCC tail where equity is already gone, but the stressed single‑B names trading in the 60–85 range, with some equity optionality still worth preserving, material refinancing uncertainty, and a 2027–2029 maturity wall ahead. In that zone, sponsors have every incentive to use drop‑downs, portability, and other structural tools to preserve optionality rather than write cheques. The lightside distributors — leveraged spread businesses dependent on inventory turnover, supplier terms, and housing volumes, with very limited hard‑asset protection — look like the natural place for this to surface first.
Operating Leverage: Where Utilisation Actually Bites
The part of the discussion that probably carries the highest practical value for HY investors is operating leverage, and it sits later in the conversation than you might expect.
On the heavyside, operating leverage is a utilisation story with hard thresholds. Cement plants and aggregates quarries are “hugely asset‑intensive” — you still have to pay maintenance, labour, environmental compliance, and depreciation, whether you are at full tilt or not. The sweet spot for cement utilisation is roughly 80–90%. Once plants drop below around 75%, fixed‑cost absorption deteriorates quickly; below about 70%, margin compression accelerates, because kilns must stay hot and energy efficiency drops sharply as loads fall. Aggregates quarries run slightly lower, with a healthy band around 70–85%, but the principle is the same: blasting, hauling, and reserve‑development costs are largely fixed, so unit economics worsen quickly if tons fall too far.
Today, US heavyside utilisation still sits on the right side of those thresholds. Residential is softer, but infrastructure and data‑centre work have kept plants in “supportive rather than stretched” territory. A cement producer running at 78% utilisation can still generate good cash flow because pricing holds and the local oligopoly remains rational.
On the lightside, the cliff is steeper and much less forgiving. Plants and branch networks were built for a 2021–22 world of 1.5 million starts and strong R&R, not for a 1.2–1.3 million environment with flat renovations. Many factories are already running below their optimal throughput; the fixed‑cost base — labour, SG&A, logistics, footprint — was sized for a bigger system. From that starting point, Belton’s estimate is that an incremental five percent volume decline can translate into a ten to twenty percent EBITDA drop and 100–300 basis points of margin compression, because you are spreading fixed costs over fewer units and have limited ability to move price.
The core difference is that heavyside has three things lightside does not: high barriers to entry, a stronger negotiating position, and hard assets that still matter at the end of the capital structure. Lightside HY has low barriers to entry, a weaker negotiating position against retailers, and very little in the way of unambiguously valuable hard assets once you are in distress. Operating leverage in that context is not an abstract concept; it is the path from “expensive but refinanceable” to “fulcrum security” over two or three reporting periods.
The QXO/TopBuild Antidote
The one apparent counterexample in this cycle is QXO/TopBuild: sophisticated strategic capital paying around 17 billion dollars for a lightside installation and distribution platform at the same time as multiple other lightside HY names are in active distress.
The way Belton framed it — “the exception that proves the rule” — is useful. TopBuild sits at the part of the light side where scale can materially change the economics: installation and distribution, rather than manufacturing. At that end, economies of scale in pricing, procurement, and logistics are real; route‑to‑market control matters; and the capital structure is not obviously mis‑sized for the underlying business. The deal says less about the average lightside HY issuer and more about what happens when you combine a decent business with genuine scale and a clean balance sheet.
For HY, the take‑away is to refine the framework, not abandon it. Within lightside, there is a difference between manufacturers who sell into concentrated retailers with low asset protection and distributors/installers who can use scale and local density to earn better economics. The former dominate the US HY building products index. The latter are rare — and, when they exist, get bought by people like Brad Jacobs.
The Infrastructure Moat and the M&A Shift
The heavyside credit story is not the one implied by top‑down construction spending headlines. Infrastructure and public construction in the US is forecast to dip in real terms in 2026, in part because the natural run‑off of IIJA and other programmes coincides with higher measured inflation in construction spending. But inflation in US construction put‑in‑place includes materials costs, so higher inflation is actually positive for those heavyside credits that sell into infrastructure projects: nominal spending can hold up even as real volumes are flat.
From the perspective of aggregate producers like Vulcan and Martin Marietta, the volume story remains quietly robust. Both are guiding to modest volume growth alongside mid‑single‑digit price increases, and both have successfully pushed through price in recent years even as parts of the construction complex softened. The more important shift is in M&A. The big transactions in the sector — Vulcan/CalPortland divestitures, CRH’s purchase of Weaver in Texas, Martin Marietta’s asset swaps with Quikrete — are not primarily about current EBITDA; they are about acquiring permitted reserves in markets where entitlements are scarce and community opposition is organised.
In high‑growth metro areas like Dallas, Phoenix, or Atlanta, securing a new quarry can take a decade or more of permitting, or simply may not be feasible. Once a company holds a permitted quarry in one of those basins, it is effectively holding a regulated‑like infrastructure asset with a multi‑decade life and a high barrier to entry, not a generic commodity plant that can be undermined by incremental capacity. That is what heavyside valuations are paying for when they trade on 15–17x EV/EBITDA: not next year’s earnings, but fifty years of irreplaceable reserves and embedded local pricing power.
The cross‑Atlantic piece sits behind this. For the first time in years, Europe’s civil‑engineering spending is forecast to outpace the US: Euroconstruct has European construction growth at 3.3% in 2026, with civil engineering the main driver. European IG building materials credit currently trades roughly ten basis points inside the broader IG index; US IG building materials sits about one basis point outside. The market is still pricing the old narrative — weak Europe, strong US — just as the data begin to suggest the opposite for infrastructure‑exposed heavyside credits.
Names like CRH, which combines US aggregates with European cement and infrastructure exposure and has relisted on the NYSE, sit squarely on that pivot. Belton’s house view has been CRH as the flight‑to‑quality trade in both EUR and USD IG. The long‑CRH / short‑Mohawk framing — Europe‑as‑call‑option plus US infrastructure on the long side, European consumer exposure and energy intensity on the short — is one expression of the idea that the market has not fully re‑rated heavyside as a structurally different asset class, especially in Europe.
The obvious downside risk is energy. If the Iran conflict escalates into a sustained oil and gas shock, with Brent holding above the 120–130 dollar range and European gas and power prices responding accordingly, the economics for glass and cement producers could deteriorate rapidly, particularly where furnaces and kilns cannot be idled. In that scenario, the heavyside premium would need to be re‑examined; until and unless that shock materialises, the infrastructure moat looks under‑priced.
What I Take Away From This — And What I Will Be Watching
1. Lightside HY is low barriers, weak bargaining power, and thin hard‑asset cover — and that combination is what is breaking, not “building materials” in general.
The stressed names — Cornerstone, JELD‑WEN, Oldcastle BuildingEnvelope, USLBM, Flytec, Pfleiderer — sit in the part of the sector with the least protection: low barriers to entry, structurally weak negotiating positions against retailers and builders, and very little in the way of hard assets that carry obvious value in distress. On top of that, they have PE‑style capital structures sized at peak 2021–22 EBITDA. When volumes slipped back toward pre‑pandemic levels and pricing normalised, leverage did not come down. We now see exactly the combination you would expect: margin compression from operating leverage, limited ability to push price, and sponsors using structuring tools rather than cheques to buy time. I will be watching the intersection of those three features in any new HY lightside underwriting: barriers to entry, bargaining power in the channel, and the quality of hard assets beneath the stack.
2. Operating leverage on the light side bites earlier and harder than most models admit.
A lot of investment‑grade work treats operating leverage as a gentle slope; the recent lightside HY experience suggests a cliff. Plants are already running below optimal utilisation, and the fixed‑cost base was built for a larger system. From there, a further five percent volume decline can take ten to twenty percent off EBITDA and 100–300 basis points off margins, with very little room to manoeuvre if you are at eight, nine, or ten times leverage. At the same time, the heavyside names most investors worry about have utilisation bands and pricing power that keep them away from the dangerous part of the curve for longer. I will be watching reported utilisation, not just revenues, in light‑side names, and asking the simple question: where is the cliff, and how far away are we in units, not in narrative?
3. The HY building products sleeve should be underwritten as one housing trade with structuring optionality attached, not as a diversified industrial basket.
Belton’s “one housing trade dressed as ten tickers” line is not a metaphor; it is how the index actually behaves in stress. The macro drivers are shared. The ownership patterns are shared. The capital‑structure design patterns are shared. In practice, that means sizing and hedging the exposure as a housing‑cycle bet, distinguishing carefully between loans and bonds, and assuming that every cov‑lite name has LME and drop‑down optionality unless you have read the documents closely enough to conclude otherwise. It also means recognising that the tools we saw first in US retail and US HY — J.Crew‑style transfers, Pfleiderer‑style Silekol structures — are now firmly part of the European playbook.
Listen to the full episode for Andy’s takes on building materials.
This article is based on Episode 13 of Fixed + Floating, featuring Andy Belton of Creditsights. The views expressed are those of the speakers and do not constitute investment advice. For more information, please visit https://know.creditsights.com/.
Fixed + Floating is a credit podcast for institutional investors and finance professionals — exploring the forces shaping global credit markets. Hosted by credit PM Josef Pschorn, the show features conversations with leading voices from investing, research, and academia.
Support Material: