

The Auto‑Supplier Problem That Refinancing Cannot Fix — Part 1: Why European Distress Is Now Structural
E14 – Daniel Steiner (PwC) and Dr. Hendrik Hauke (Willkie) map why European auto‑supplier distress is now structural rather than cyclical, and where in the stack the pressure actually sits.

European auto‑supplier distress no longer looks like a cycle that will burn off on its own. Roughly a third of the supplier base sits in the distressed zone and that proportion has barely moved in two years — at levels that used to mark the bottom, not the middle, of a downturn.
In the podcast, Daniel Steiner and Hendrik Hauke walked through the mechanics from the factory floor to the courtroom. This note is the companion piece: it sets out why suppliers, as a group, no longer earn their cost of capital, why overcapacity makes refinancing the wrong instrument, how China is resetting the profit pool, and how that translates into credit work on names as different as Schaeffler, ZF or a €250m tier‑2.
The plateau, not the cycle
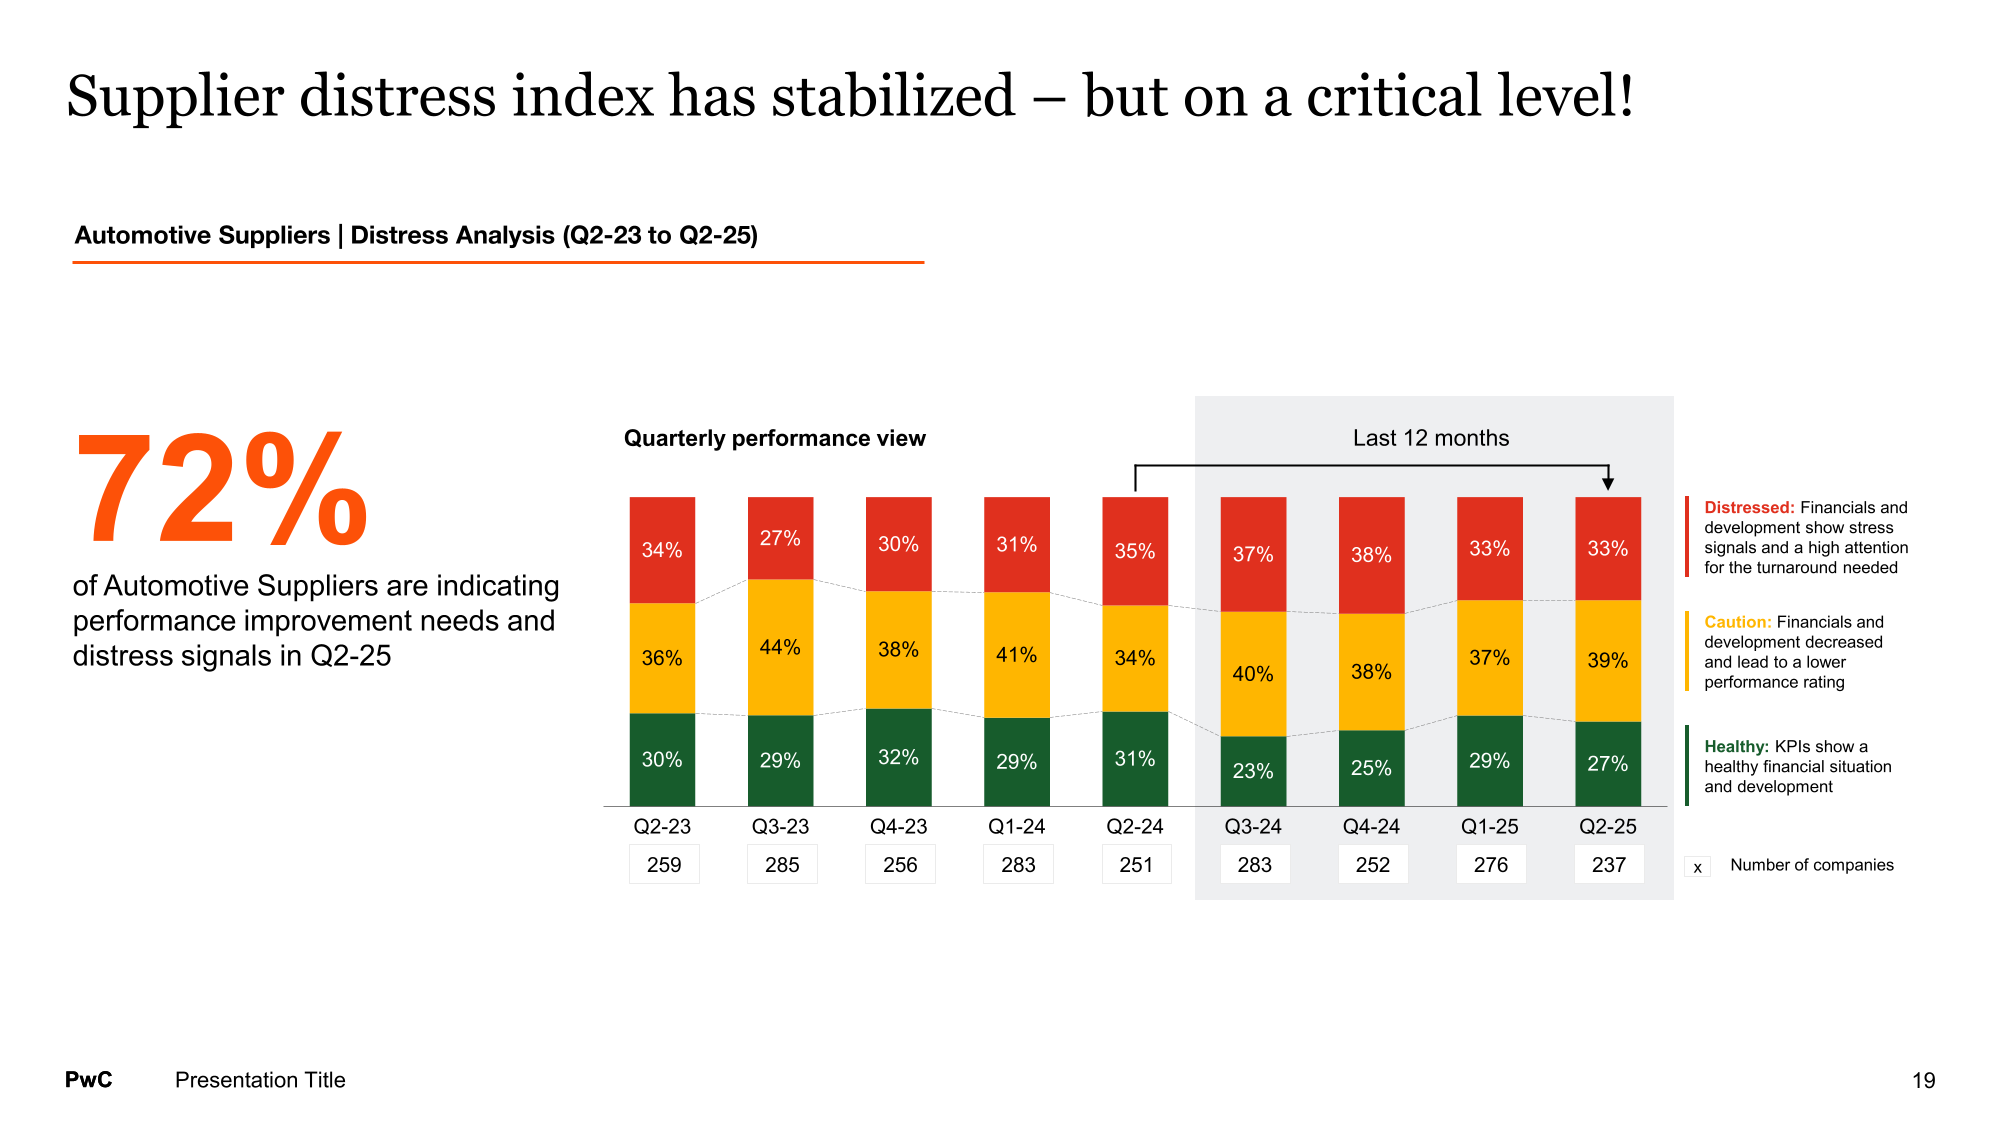
]The starting point is a survey statistic that is easy to quote and hard to ignore. Around 40% of automotive CEOs say their company will not exist in ten years if they do nothing; over 70% of European suppliers signal performance‑improvement needs; about a third are explicitly distressed, meaning they already face difficulty refinancing.
The character of the number is what matters. In previous cycles, a third of the universe in distress marked the bottom. Today that third is not shrinking between surveys. Top‑line revenue has recovered to roughly 2019 levels and then flatlined, while both the cost base and the cost of capital have deteriorated. A sector that has clawed back its pre‑pandemic revenue but runs with a structurally worse balance sheet and cost structure is not mid‑cycle. It is at a new equilibrium, and the equilibrium is uncomfortable.
The Tier‑1 sandwich
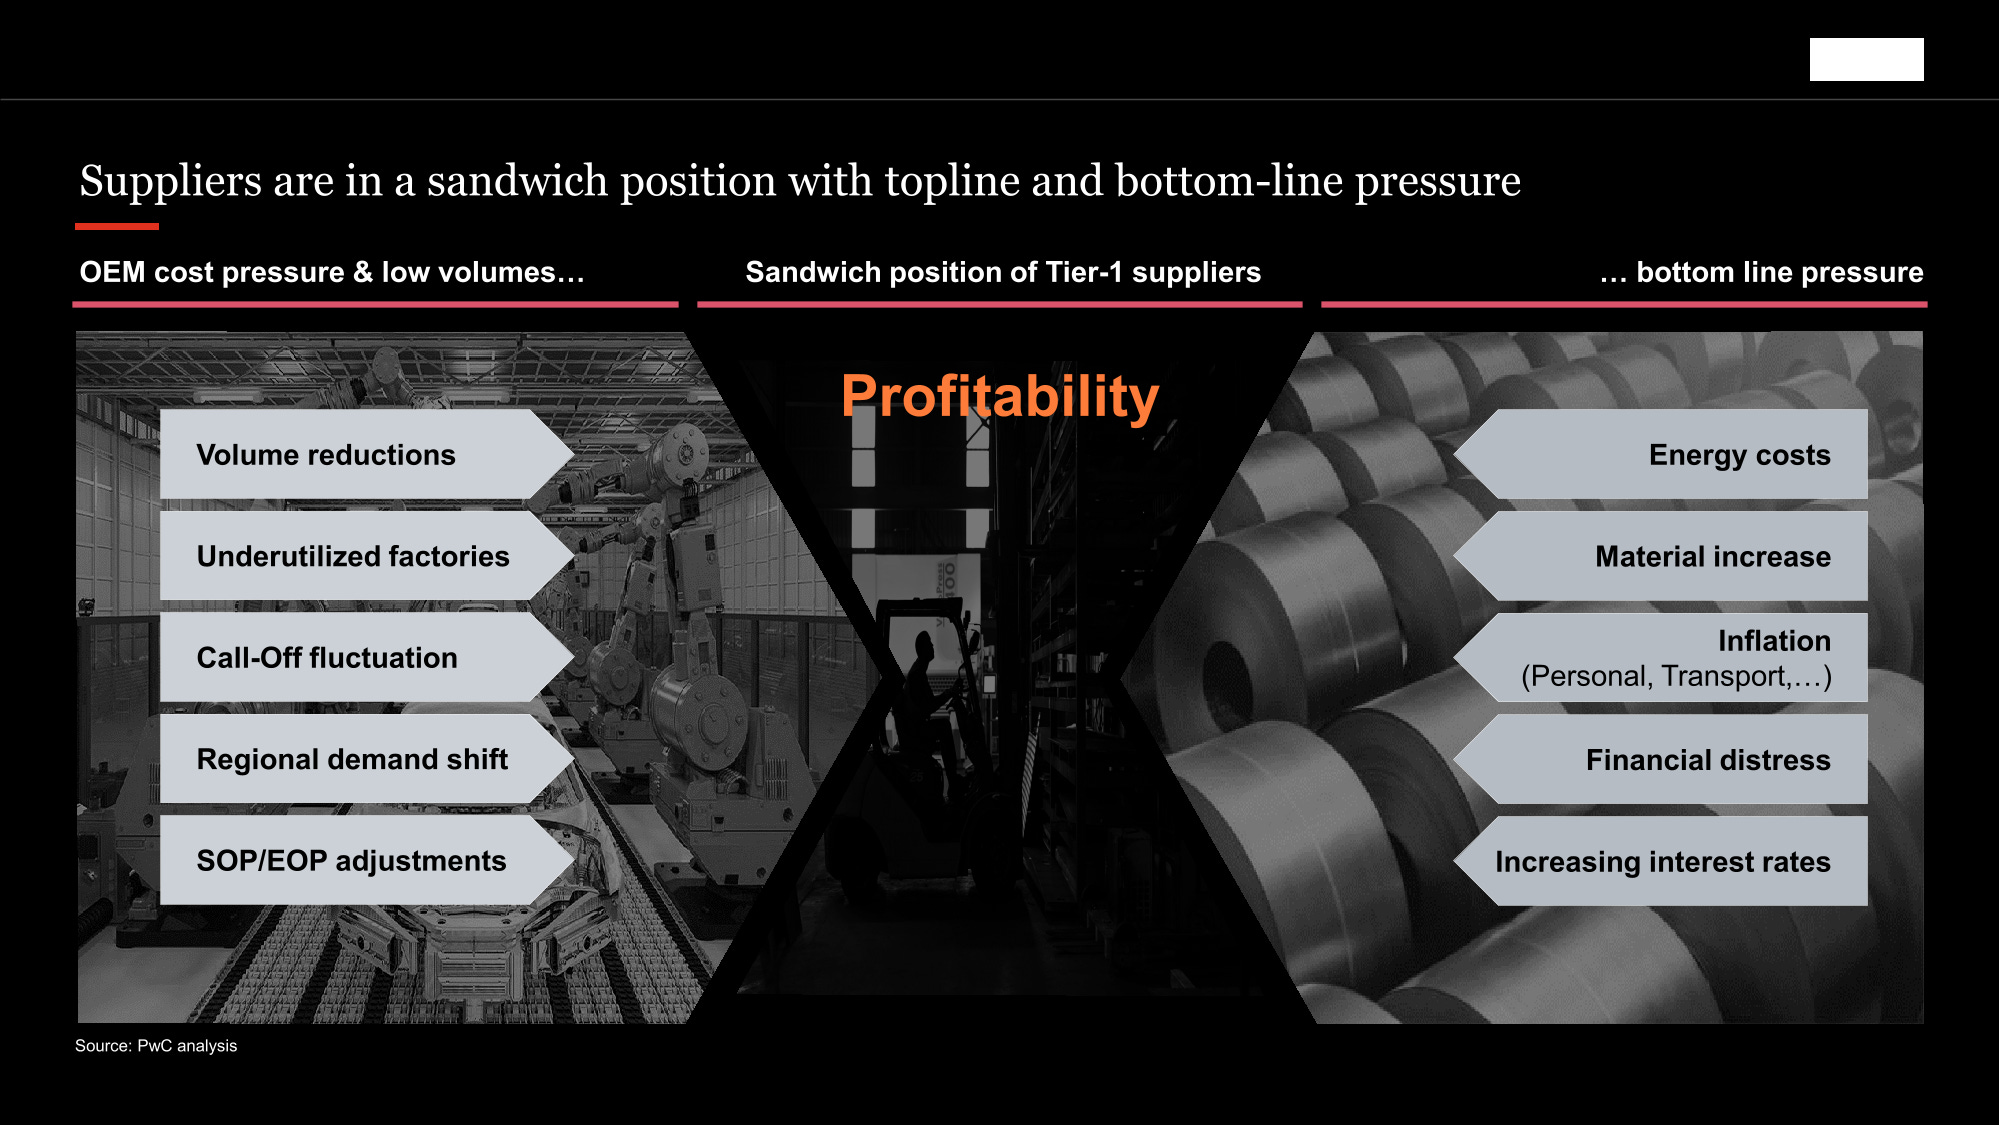
Steiner’s P&L picture is a sandwich. From the top you have volume reductions, under‑utilised factories, OEM call‑off fluctuations and regional demand shifts — every one of which compresses revenue with limited warning. From the bottom you have energy, material, transport and personnel costs, rising interest expense and outright financial distress. The supplier sits in the middle with limited ability to pass on pressure in either direction.
For most of the last two years, the bottom did the damage: German material and labour costs rose while productivity fell; energy prices sat at multiples of Asian levels. More recently, the top has reasserted itself because OEMs are under margin pressure and are pushing it back down the chain. For credit, the relevant point is that the squeeze is now bilateral. This is not a 2009‑style volume collapse with a clean rebound; both sides of the P&L are slow‑moving headwinds.
The profit pool inverted — and China is setting the benchmark
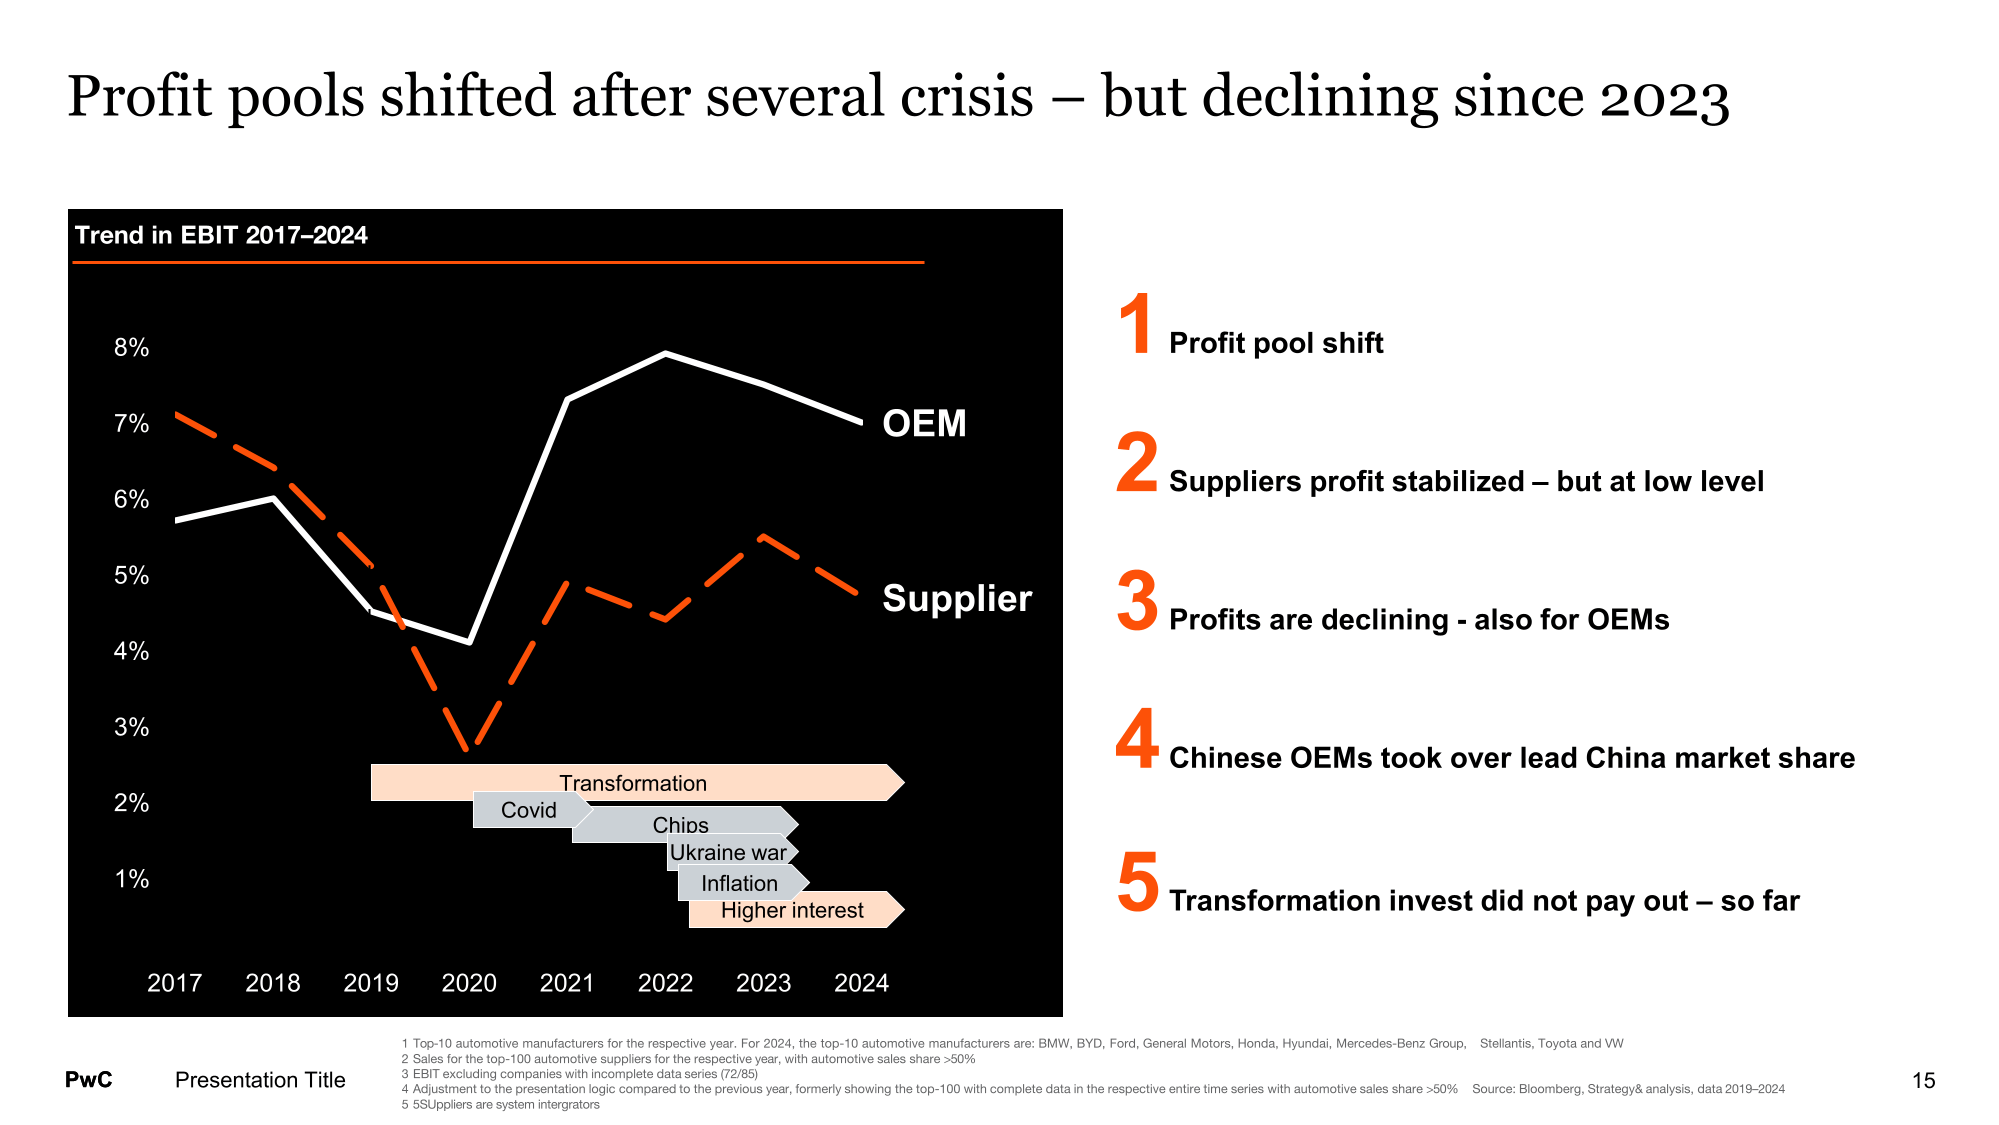
The single chart that frames the episode is the one that shows supplier and OEM profit pools crossing. In 2017–2018 the average supplier out‑earned the average carmaker; by 2024 that relationship had inverted and then sagged for both. Through the pandemic, supplier EBIT margins fell from roughly 7% to about 4%, while OEMs — helped by tight supply and mix — improved their profitability. The part of the chain that historically captured the better margin became the part that captured the worse one.
Since 2023 both supplier and OEM margins have been falling together. That removes the usual safety valve. In a normal cycle, a stressed supplier leans on a healthier OEM for volume, price relief or bridge support. When the OEM’s own margin is contracting, that option disappears. The OEM that might once have absorbed a supplier’s cost inflation is now exporting its own. Distress does not dissipate in that configuration; it propagates.
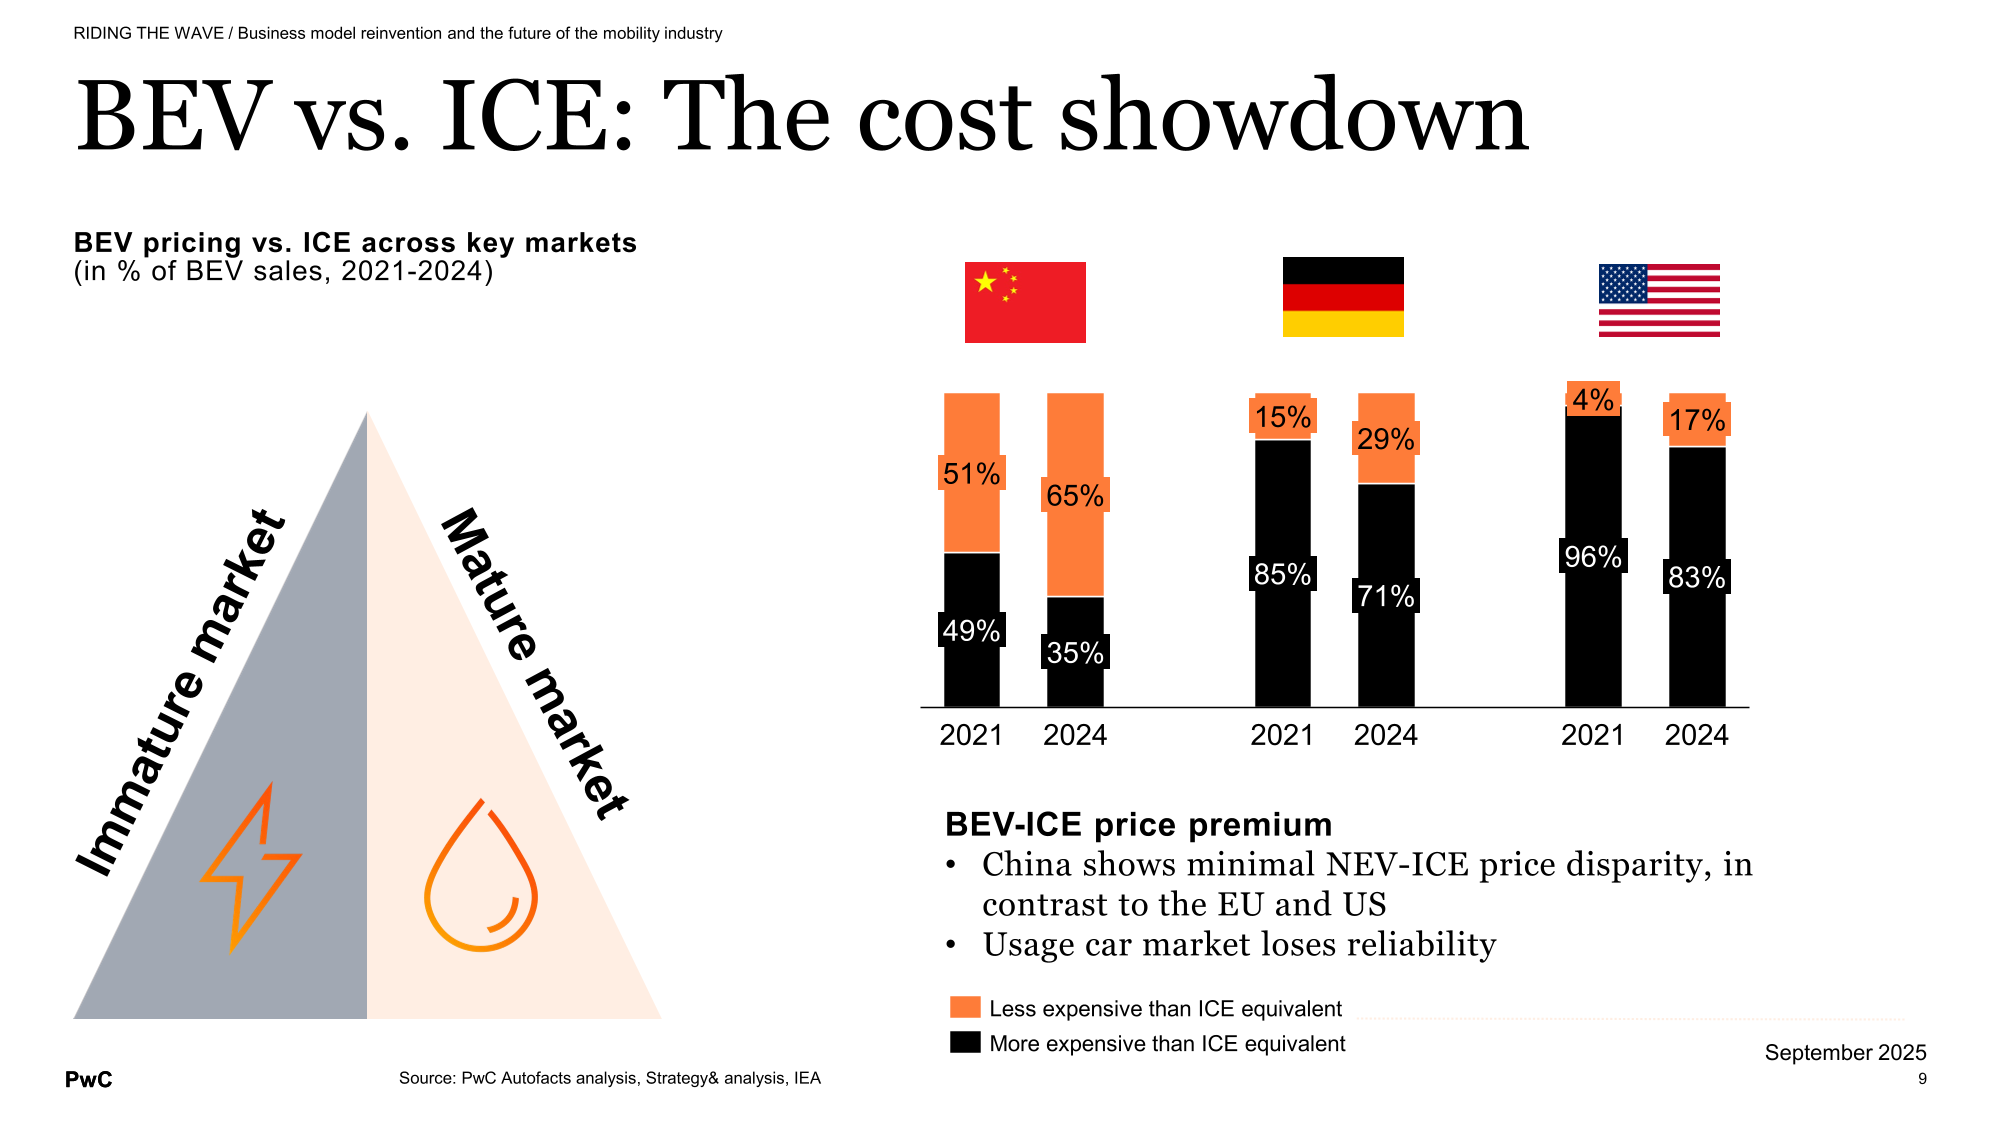
Underneath the margin story sits a content story. A 2026 BEV simply contains less of what the German supplier base was historically best at. The exhaust system, classic transmission and fuel system are gone. The value migrates towards the battery and the software‑defined EE stack — battery management, ADAS, power electronics, thermal — where Chinese suppliers now offer solutions at a fraction of Western prices with acceptable performance. For a supplier whose problem is portfolio relevance rather than cost control, the first question is no longer “how do I cut costs” but “do I still make anything the vehicle needs.”
Steiner’s China trip made that tangible. In Beijing, drivers sit through red lights that last several minutes, shopping or doing karaoke on large in‑car screens; the car is competing with the smartphone for attention in a traffic jam, not with an autobahn for handling at 200 km/h. The local OEMs design around that use case: rear‑seat comfort, entertainment, and software first; horsepower much further down the list. A “global car” designed for every market at once is under pressure when the Chinese customer is optimising for time in traffic and the German one for time on the motorway.
The OEM profit hole: 30–40% of earnings tied to China
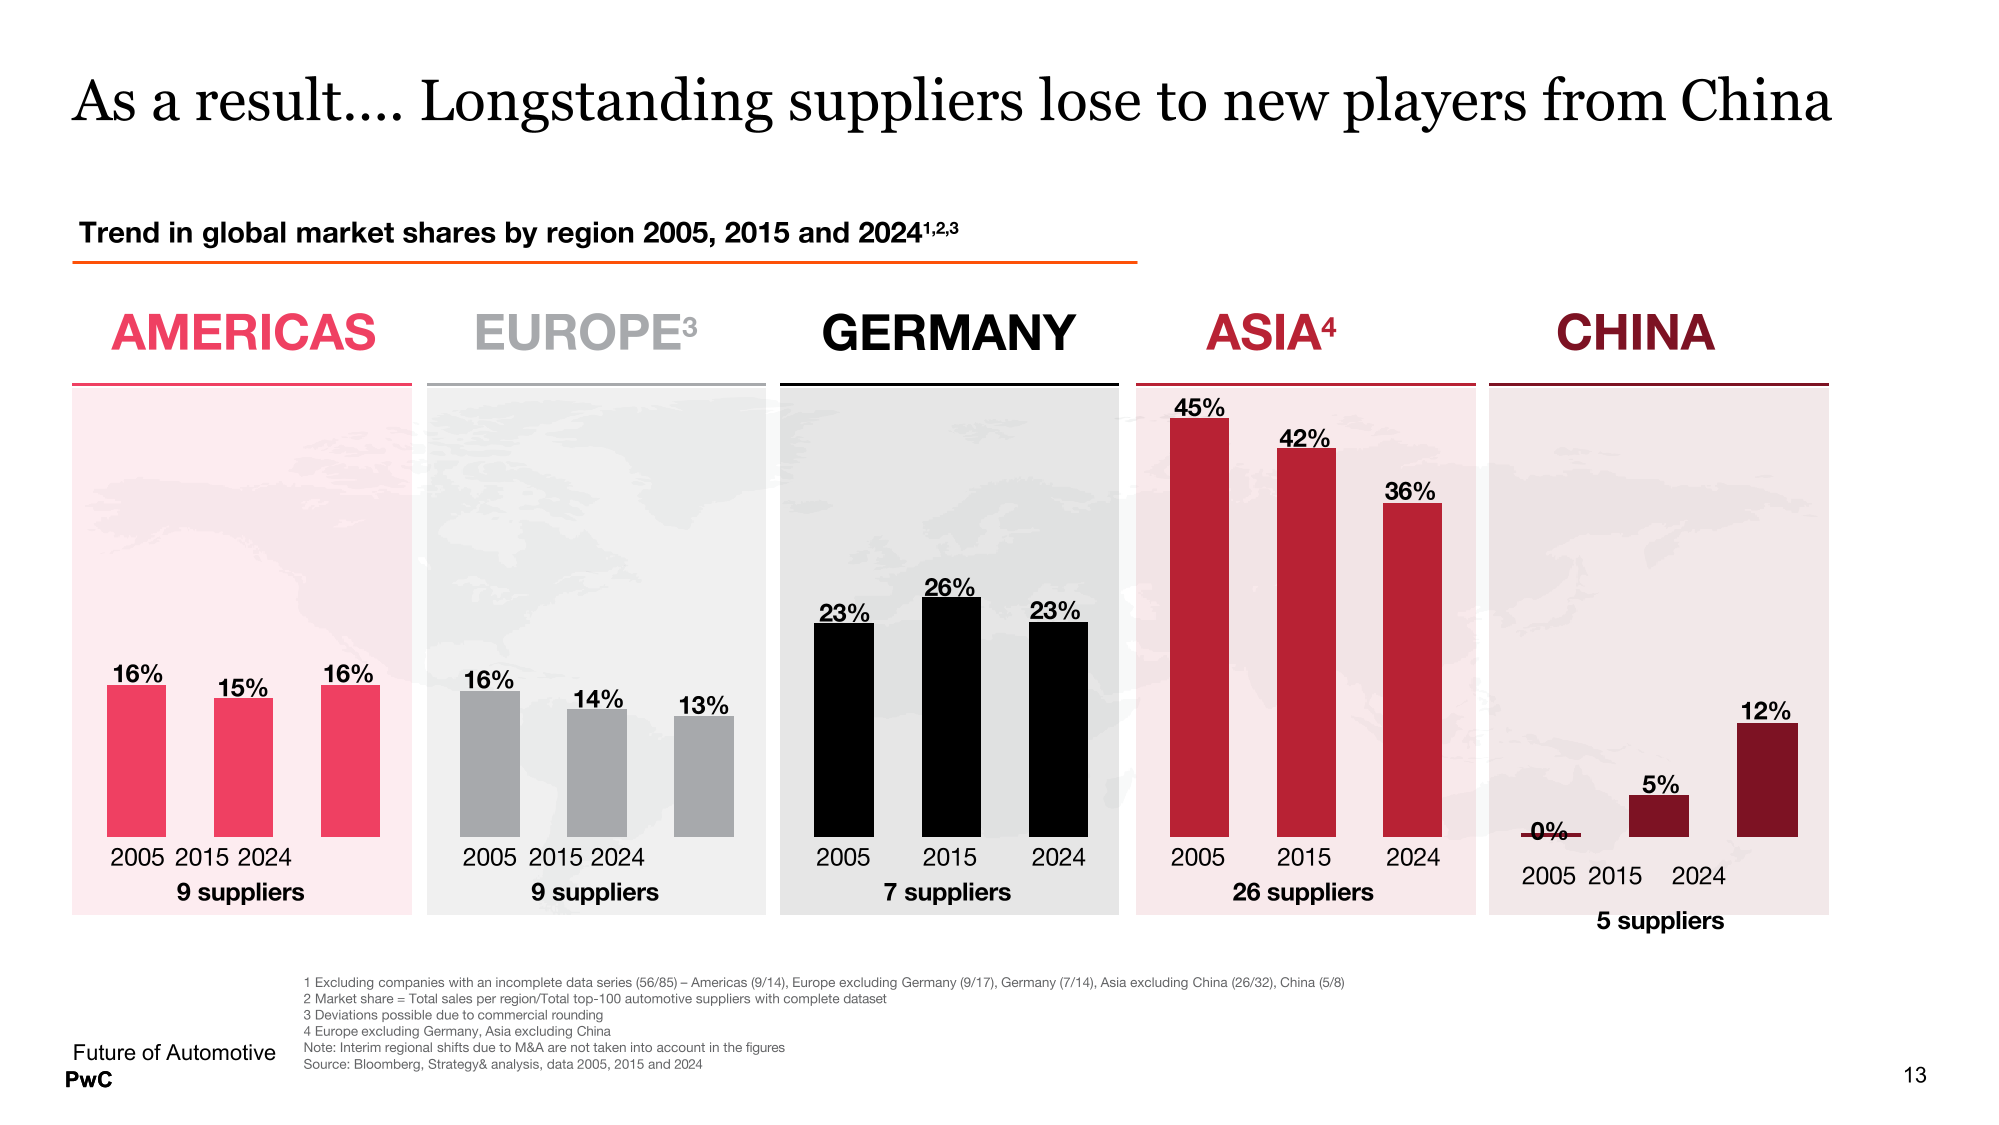
For German OEMs, China is not a side market. At peak, roughly 30–40% of their group profit came from China. Since then their China market share has fallen from about 25% of the market to closer to 15%, taking a disproportionate share of the profit pool with it. The local competition now includes well over 100–150 Chinese OEMs, many focused on EVs with shorter development cycles, localised software and integrated domestic supply chains.
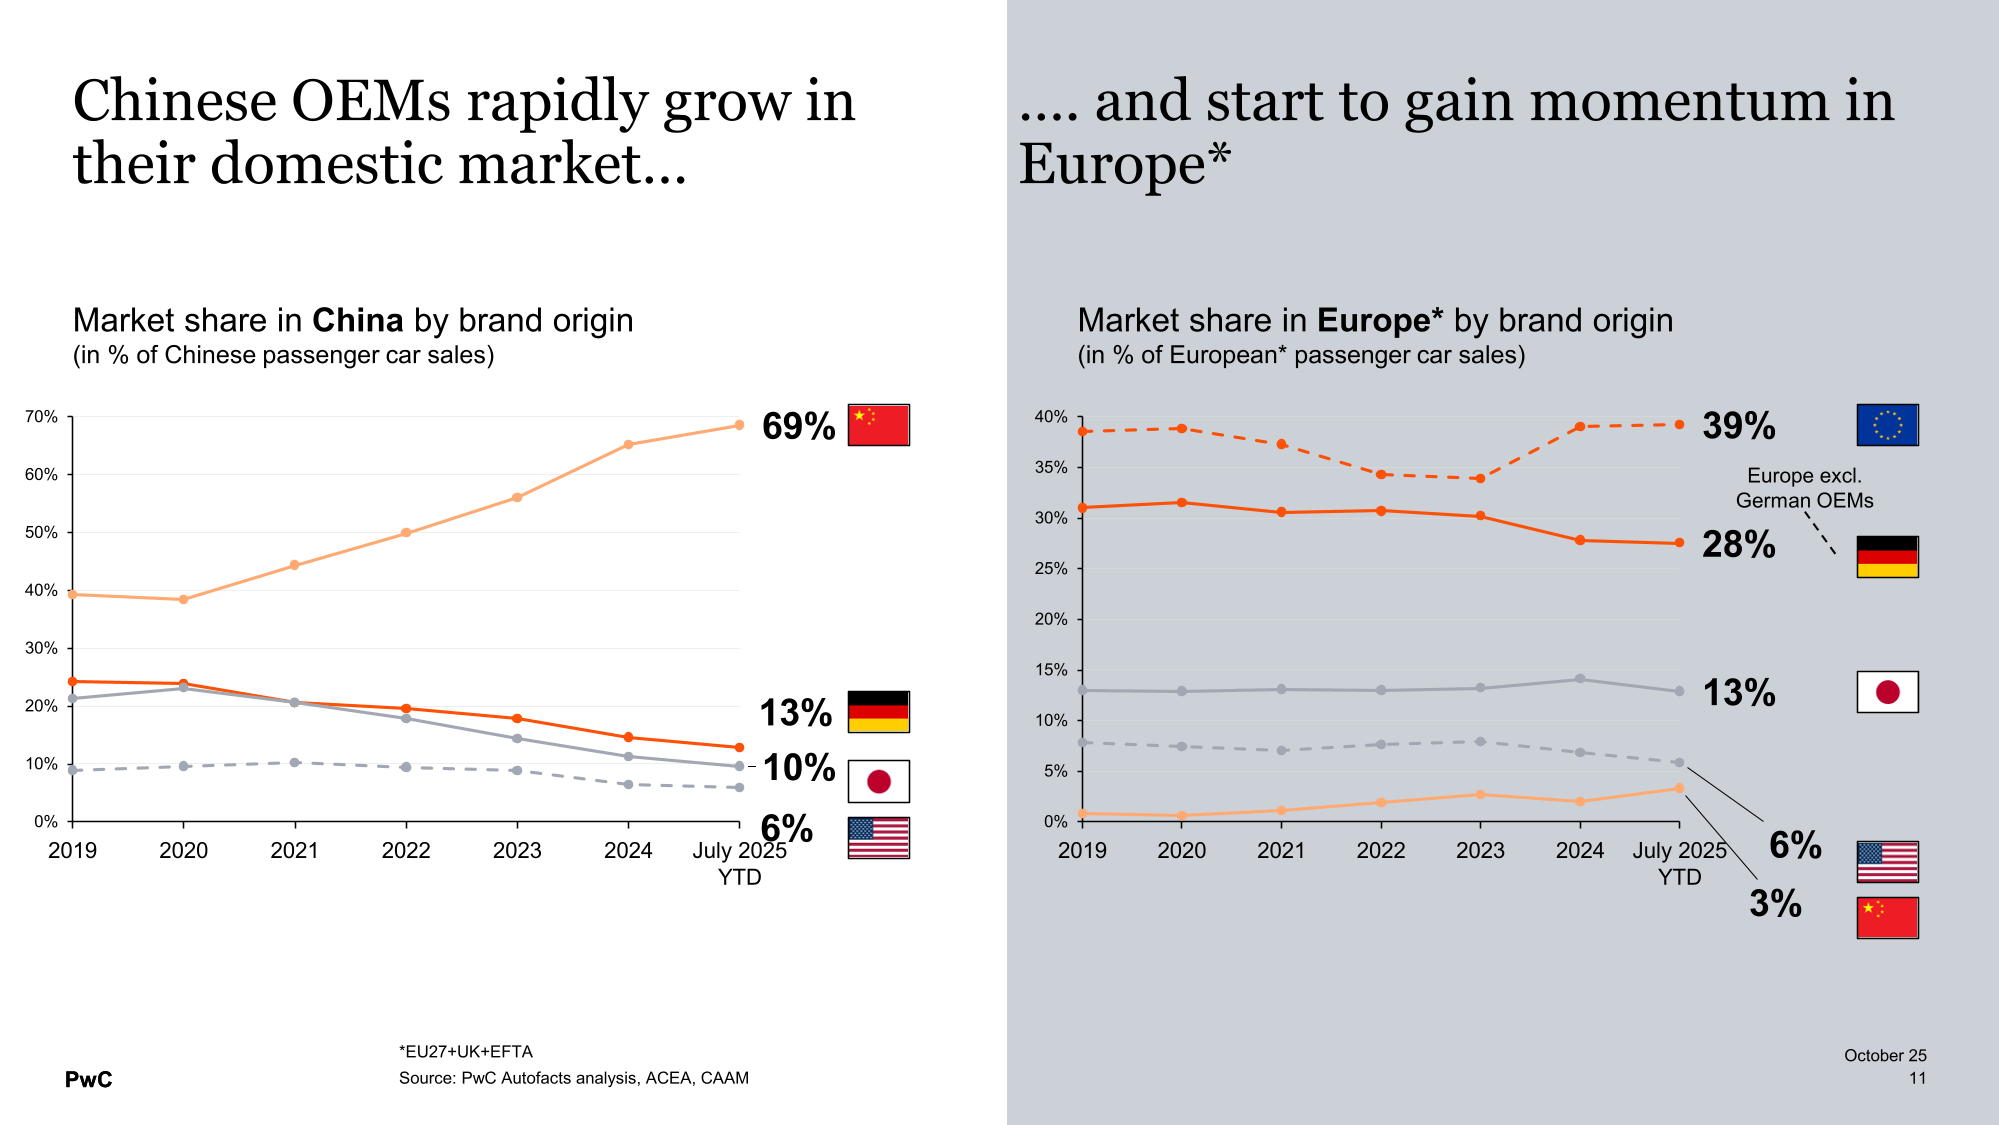
That shift is why OEMs have much less room to “carry” weak European suppliers than they did in the 2010s. A P&L that used to be supported by China is now squeezed there, and the natural response is to push price and volume pressure back into the domestic supply base. For suppliers, the China problem does not show up as a line item in their own accounts; it shows up as fewer levers left at their customers.
China’s supplier margins — and the neck‑breaker scenario
The contrast with China is uncomfortable for suppliers. In the domestic NEV ecosystem, supplier margins still sit above OEM margins; suppliers in China currently earn materially better returns than their European or US peers on comparable content, helped by scale, vertical integration, cheaper labour and subsidised inputs. When Steiner compares Western ADAS stacks with Chinese ones, he finds Chinese offerings priced at roughly a tenth of the Western equivalents, with technology that “works pretty well” — something he tested himself on the streets.
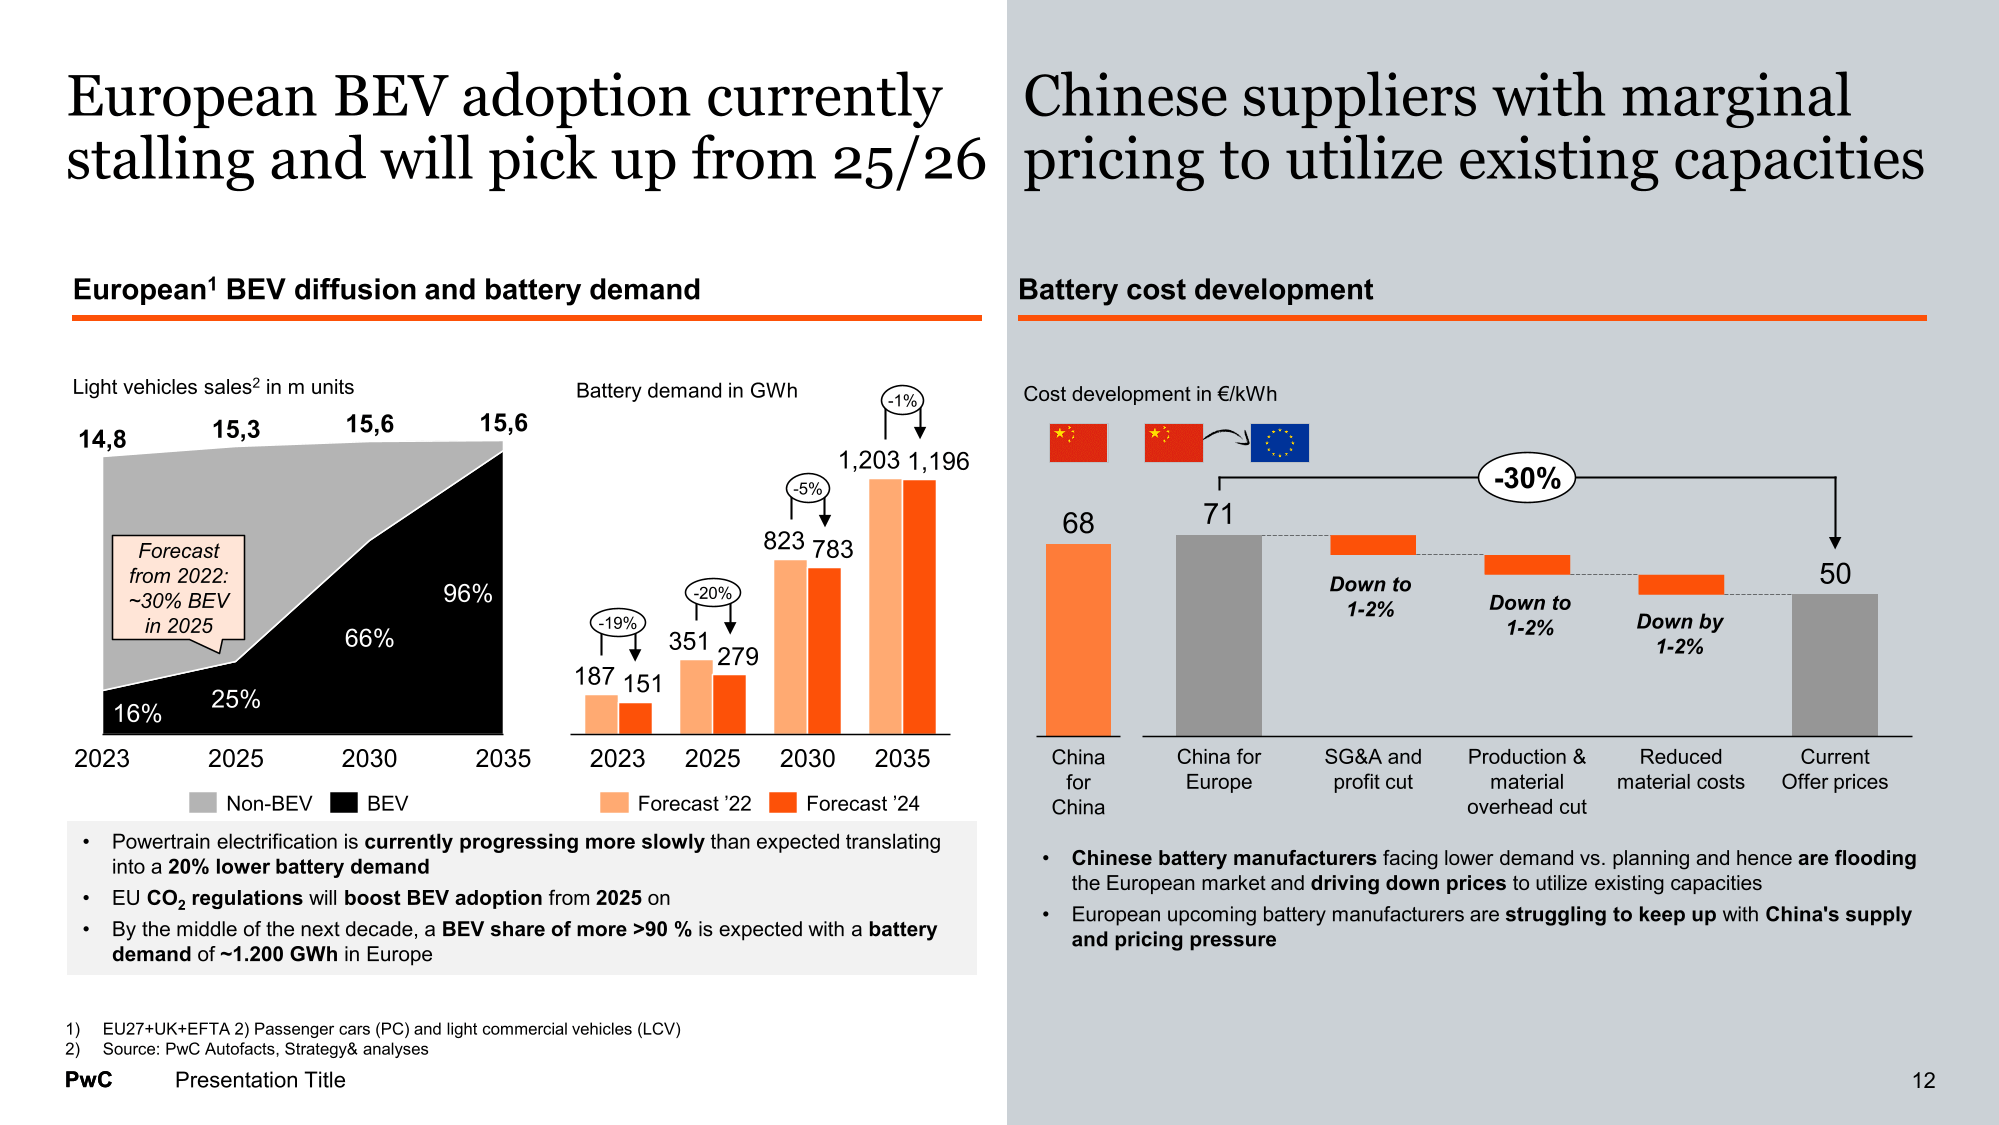
That cannot last indefinitely. With around 50% overcapacity and more than 100–150 OEMs in the field, Steiner expects China to consolidate down to closer to ten domestic OEMs by 2030. In that process, supplier margins will be squeezed as well, and domestic Chinese competitors will replace some of today’s suppliers. The neck‑breaker for European suppliers is what happens if that consolidation leaves a handful of Chinese OEMs and suppliers who can still earn decent economics at a price level that sits structurally below the European cost curve. In that world, the global price anchor for key components is set in a geography where the European cost base simply cannot follow.
The constraint is capital, not margin
This is the point where the operating narrative and the credit narrative diverge. If you only watched margins, you would expect distress to ease wherever a supplier stabilises its operations. That is not what the balance sheets are telling you.
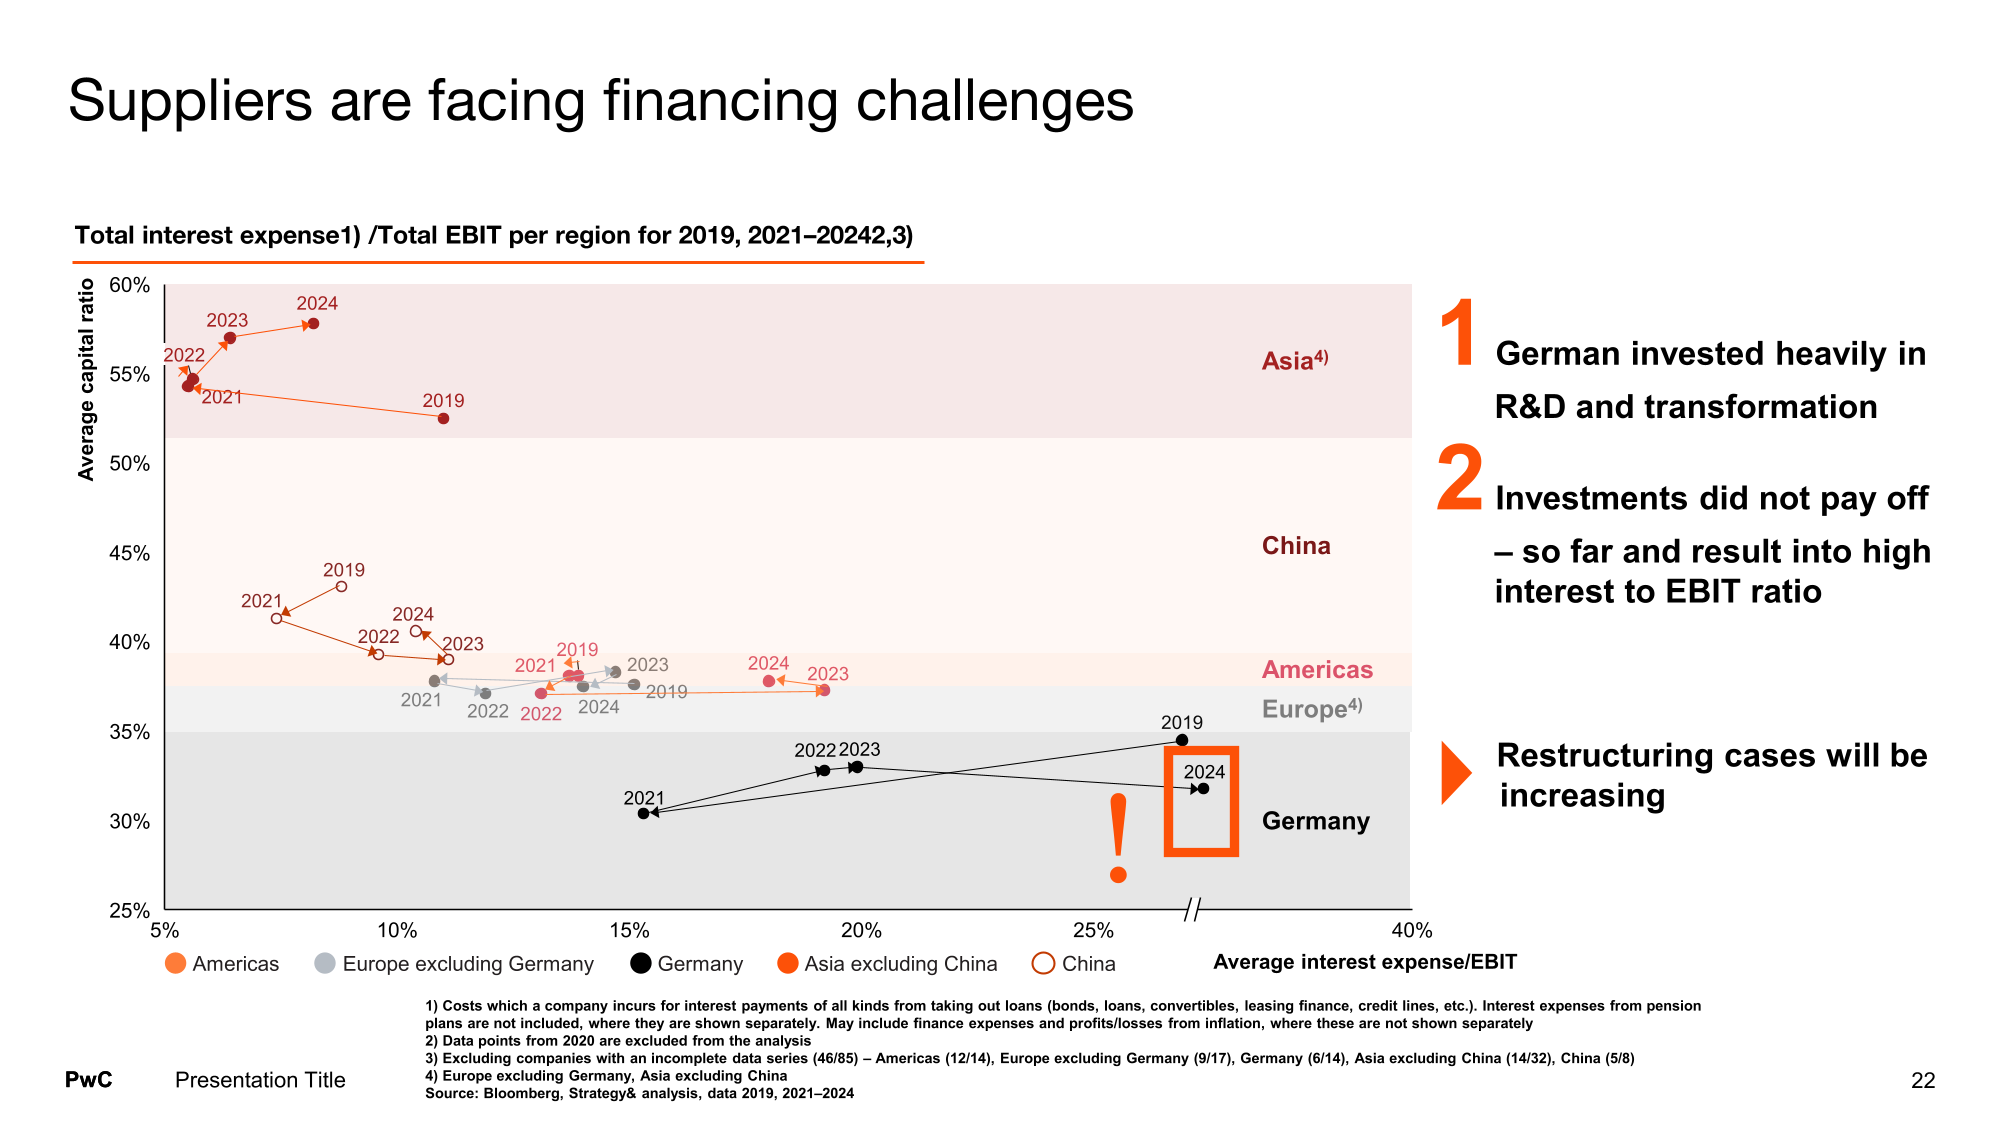
On Steiner’s numbers, German suppliers run the highest interest‑expense‑to‑EBIT ratio of any region. Part of that is price; part of it is that capital structures were built for pre‑2020 volumes and pre‑2022 funding markets. The legacy coupons on bank debt and Schuldscheine do not look extreme in isolation. The problem is that the refinancing that is available today clears at much higher yields, if at all, into a system with less appetite for automotive risk.
A good supplier can still produce an 8–10% EBITDA margin on paper. If the all‑in cost of funding after refi sits above that level, the structure contains a break point that no amount of factory‑floor work removes. Hauke’s shorthand — if your financing cost is in the low‑ to mid‑teens and your EBITDA margin is eight or nine, you have a breaking point — captures the mechanism. The same operating result that stabilises a US supplier can leave a German one stuck, because the German supplier is paying more to carry the same nominal leverage and, crucially, may not be able to refinance at all on like‑for‑like terms.
From a credit perspective, the conclusion is blunt. In aggregate, German suppliers do not earn their cost of capital at current leverage and spread levels. Most are overlevered for the cash flows their portfolios can realistically produce. Debt reduction is not a nice‑to‑have; it is the core of the investment case.
Overcapacity makes consolidation the cure
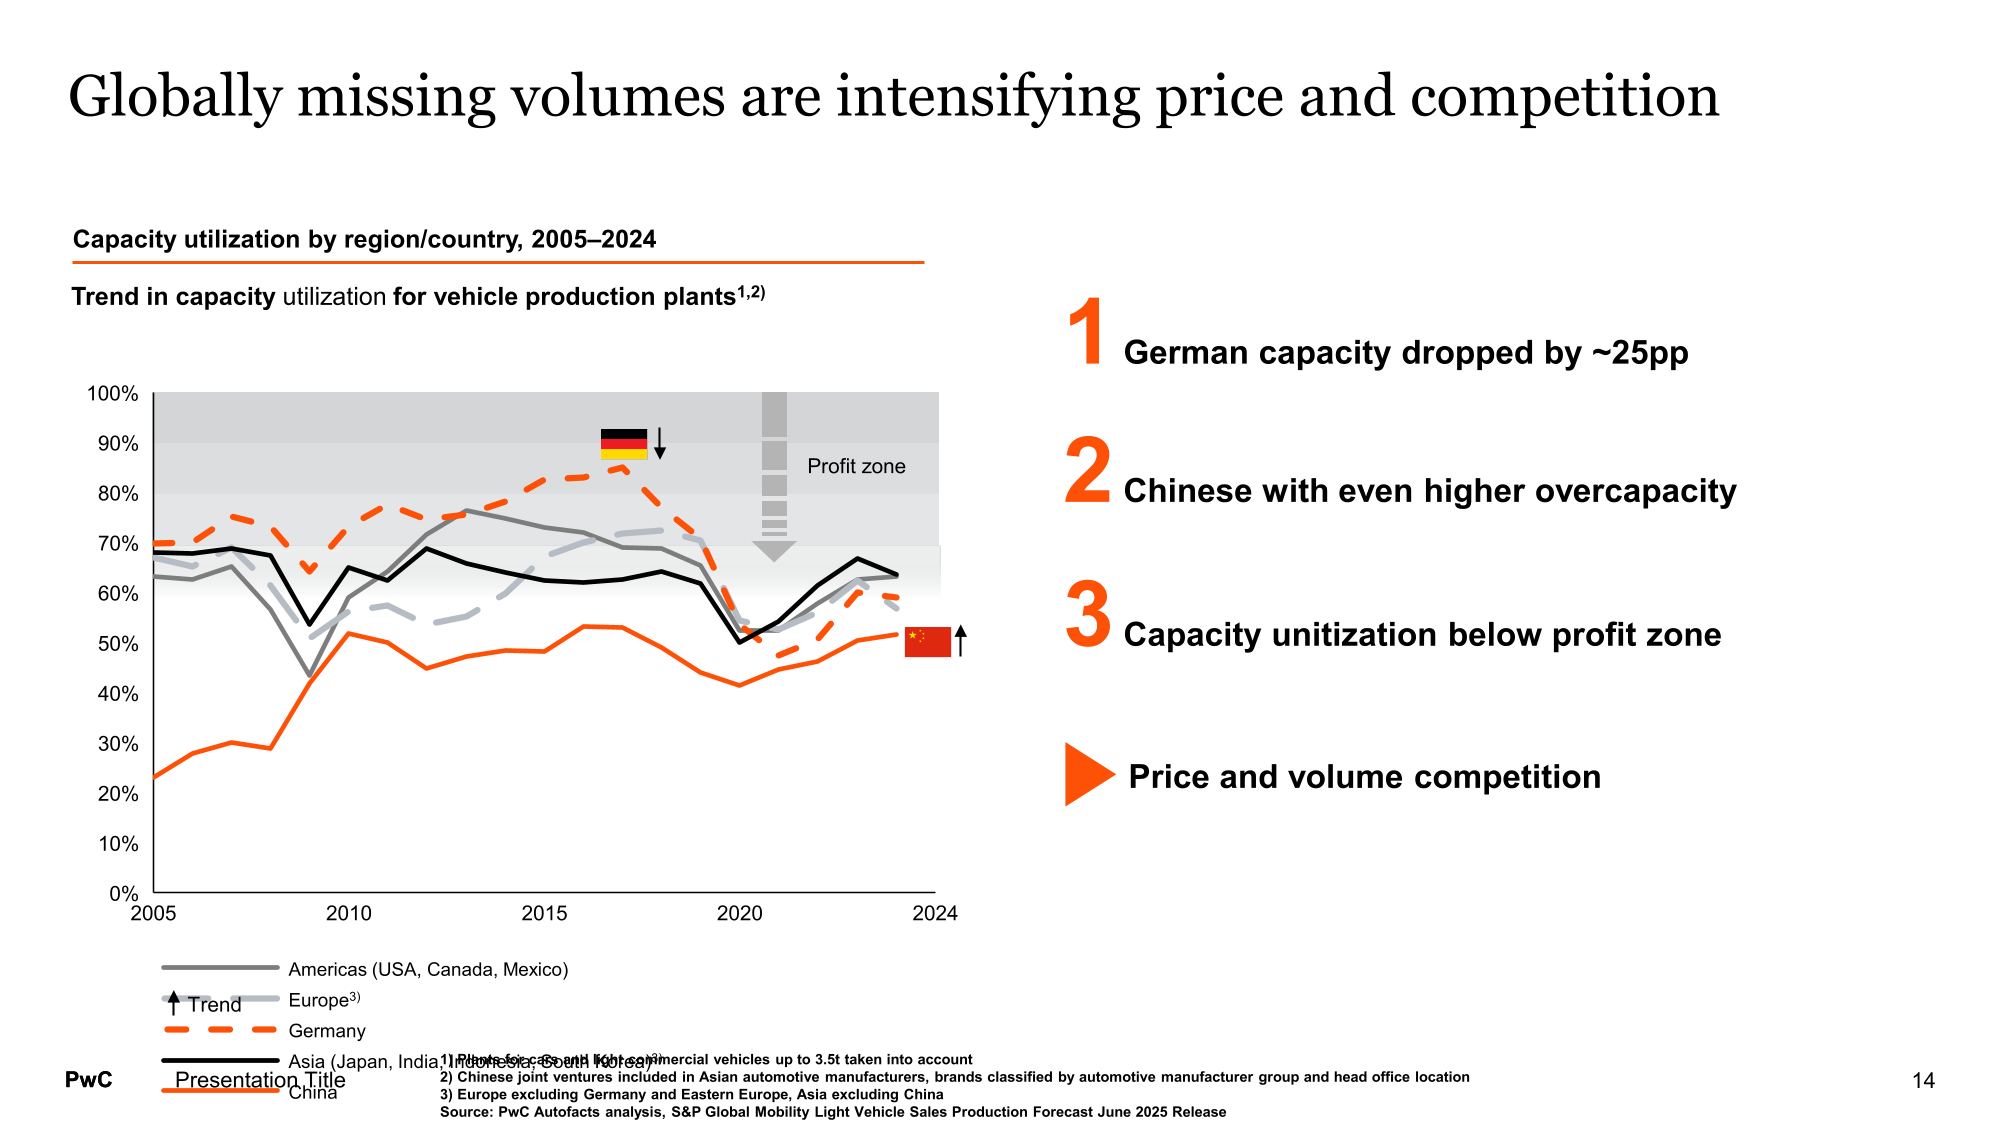
If capital is the constraint, overcapacity is the disease underneath it. Europe is running with roughly 25–30% excess capacity; China with closer to 50%; North America, having already consolidated, sits in better shape. German plant utilisation has fallen by about 25 percentage points and now sits below the level at which plants are economically viable.
You cannot refinance your way out of structural oversupply. The cash needed to service new debt is exactly what the surplus capacity destroys. North America makes the point in reverse: capacity came out first, and supplier margins only normalised after that process. For Europe, the relevant lever is physical: which plants shut, which lines are sold, which portfolios are broken up. Refinancing, on its own, extends the period over which the excess capacity does damage.
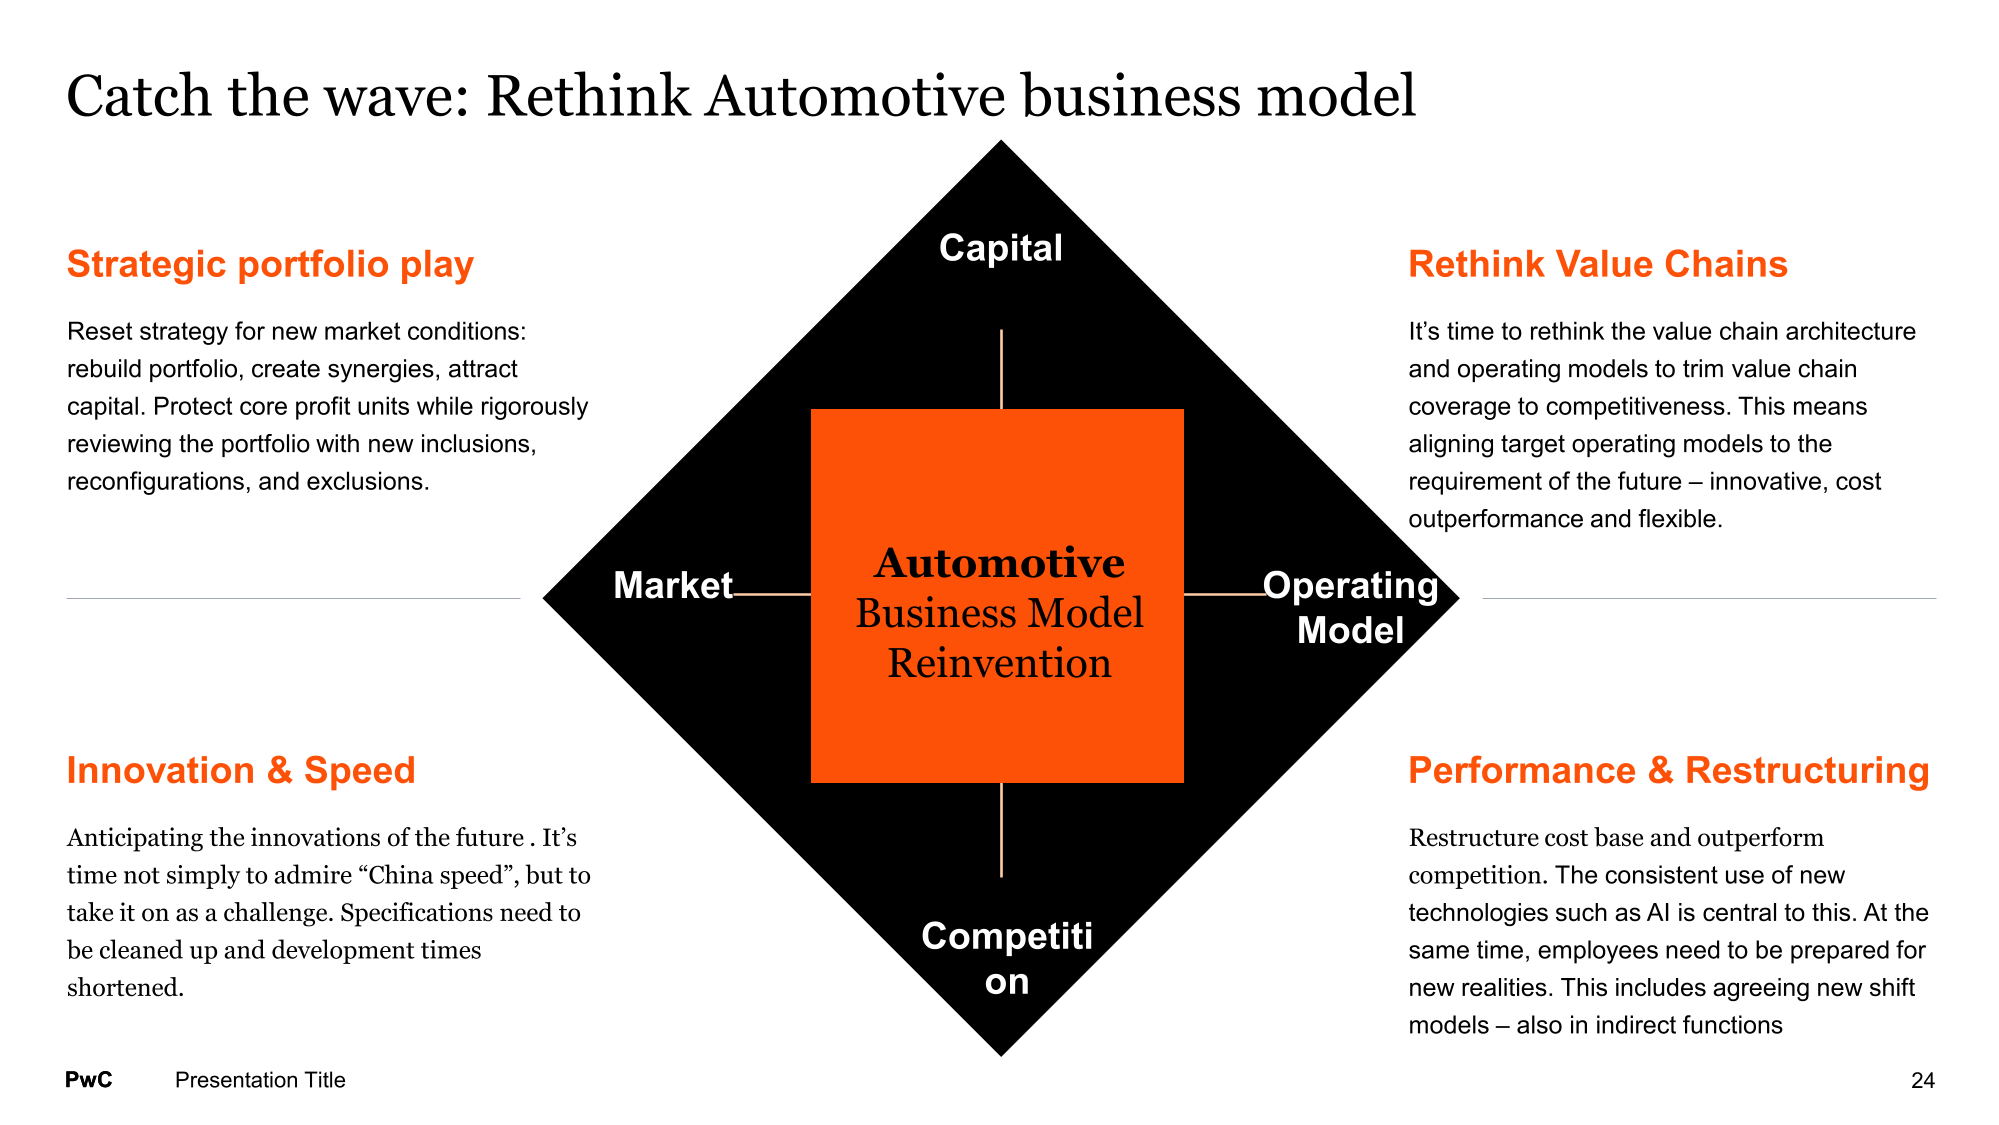
For divestitures, this shifts the arithmetic. A business line that clears at 3–5x EBITDA, below the 4–5x that used to be the norm, can still be the right sale if it removes capacity and debt from a system that has too much of both. Steiner’s “Tetris” picture is accurate: you move blocks to build a more efficient stack, retire the pieces that have no future, and keep some legacy capacity alive longer than you would like because ICE content still needs to be supported through a slower‑than‑planned phase‑out. None of that is free, which is precisely why it cannot be funded with can‑kick refinancings.
The obvious objection is competition law. Hauke’s view is that the fear is overstated. The market is still highly fragmented; OEMs have no interest in creating a single 60–80% supplier in any given component; and “last‑man‑standing” situations, where one supplier continues to produce a critical component, are easier to defend than textbook monopolies in growth markets. The real constraint is not doctrine but coordination: aligning OEMs, regulators and lenders around a consolidation plan that takes capacity out rather than pushing maturities out.
Sorting the survivors
Not every distressed supplier is a wind‑down. The discipline that separates a turnaround from a managed exit is directly usable as a screening tool.
Steiner works with four questions:
Portfolio relevance: Does this product still have a role in the vehicle, and on what time horizon? With ICE living longer than expected, some legacy lines stay profitable for longer than consensus assumed; others have no role in a 2030‑plus fleet.
Portfolio reshaping: Are there credible M&A or partnership options — joint ventures, regional deals, carve‑outs — that can move a sub‑scale or non‑core unit into a better owner’s hands?
Capabilities: Does the company have the operational and engineering depth to execute in the segments that matter — or is it structurally behind in battery, ADAS, power electronics, software and the relevant EE architectures?
Capital access: Even with good answers to (1)–(3), is there a shareholder and funding base willing to support a three‑ to five‑year restructuring process?
Two further conditions gate any real turnaround. There has to be a stable, committed owner prepared to fund a multi‑year process, and there has to be basic execution capacity — the right footprint, transparency on unit economics and management depth. Where those are missing, the honest label is “managed wind‑down”, not “turnaround”.
Forvia: the framework in practice
Forvia is the example that shows the framework being applied. Under Martin Fischer, the company suspended its dividend, ran cost programmes, and sold its interiors business to Apollo at a sub‑group margin. The sale did not look attractive if you only looked at the multiple. It made sense because it freed capital, took a lower‑relevance unit off the books and signalled that the group was prepared to reshuffle the portfolio rather than carry everything into the new regime.
That is what a working consolidation trade looks like in a large tier‑1: not a single “heroic” turnaround, but a sequence of disposals and restructurings that move capacity and capital into the parts of the chain that can still earn their cost of capital, and away from those that cannot.
What I take away for credit (Part 1)
1. German suppliers, in aggregate, do not earn their cost of capital — debt reduction is the thesis. On Steiner’s numbers, German suppliers run the highest interest‑expense‑to‑EBIT ratios globally, off balance sheets built for a different volume and spread regime. Even where reported EBITDA margins sit in the high single digits, the all‑in cost of funding after a 2027–29 refi is above that level for a large part of the universe. For IG names with real scale (ZF, Continental), that shows up as a tighter headroom to fund capex and M&A.
2. Consolidation is the cure, but the path is issuer‑specific. Europe’s 25–30% overcapacity is a sector fact; no amount of refinancing changes it. At the top end (ZF, Forvia, large private groups) the consolidation trade runs through portfolio reshuffles, asset sales and selective exits — Tetris played with multi‑billion‑euro blocks. In the Mittelstand, consolidation is more brutal: unprofitable or stranded plants shut; portfolios get carved up between stronger peers; small suppliers disappear without a headline because nobody has the balance sheet or the incentive to carry them. ed is a warning sign, not a comfort.
3. The neck‑breaker is a China‑driven reset of price and margin expectations into a European cost base that cannot follow. Chinese suppliers currently earn better margins than European peers on the same electronic and battery content, helped by scale, subsidised inputs and integrated ecosystems. If Chinese OEM and supplier margins compress further, the global price anchor for key components will be set even further below the European cost curve. For premium German OEMs already losing share and profit in China, the natural response is to push that pressure back into their own supplier base. In that world, the European supplier problem is not just leverage and cost of capital; it is that the margin pool used to service that capital is being repriced by a competitor with structurally lower unit economics.
Part 2 looks at what happens when these operational fixes are not enough and the maturity wall is in sight — and how the current restructuring toolkit gets used in auto suppliers.
Listen to the full episode for Daniel’s and Hendrik’s takes on auto suppliers.
This article is based on Episode 14 of Fixed + Floating, featuring Daniel Steiner of PwC and Dr. Hendrik Hauke of Willkie Farr & Gallagher. The views expressed are those of the speakers and do not constitute investment advice. For more information, please visit https://www.pwc.de and https://www.willkie.com.
Fixed + Floating is a credit podcast for institutional investors and finance professionals — exploring the forces shaping global credit markets. Hosted by credit PM Josef Pschorn, the show features conversations with leading voices from investing, research, and academia.exploring the forces shaping global credit markets. Hosted by credit PM Josef Pschorn, the show features conversations with leading voices from investing, research, and academia.
Support Material: