


CCC spreads have widened sharply while single-B spreads have remained comparatively tight. At 30 September 2026, US CCC-and-lower OAS stood at approximately 1,244bp, against 310bp for single-Bs.1 The divergence invites an early-warning interpretation: stress at the bottom of high yield will eventually spread to better-rated borrowers.
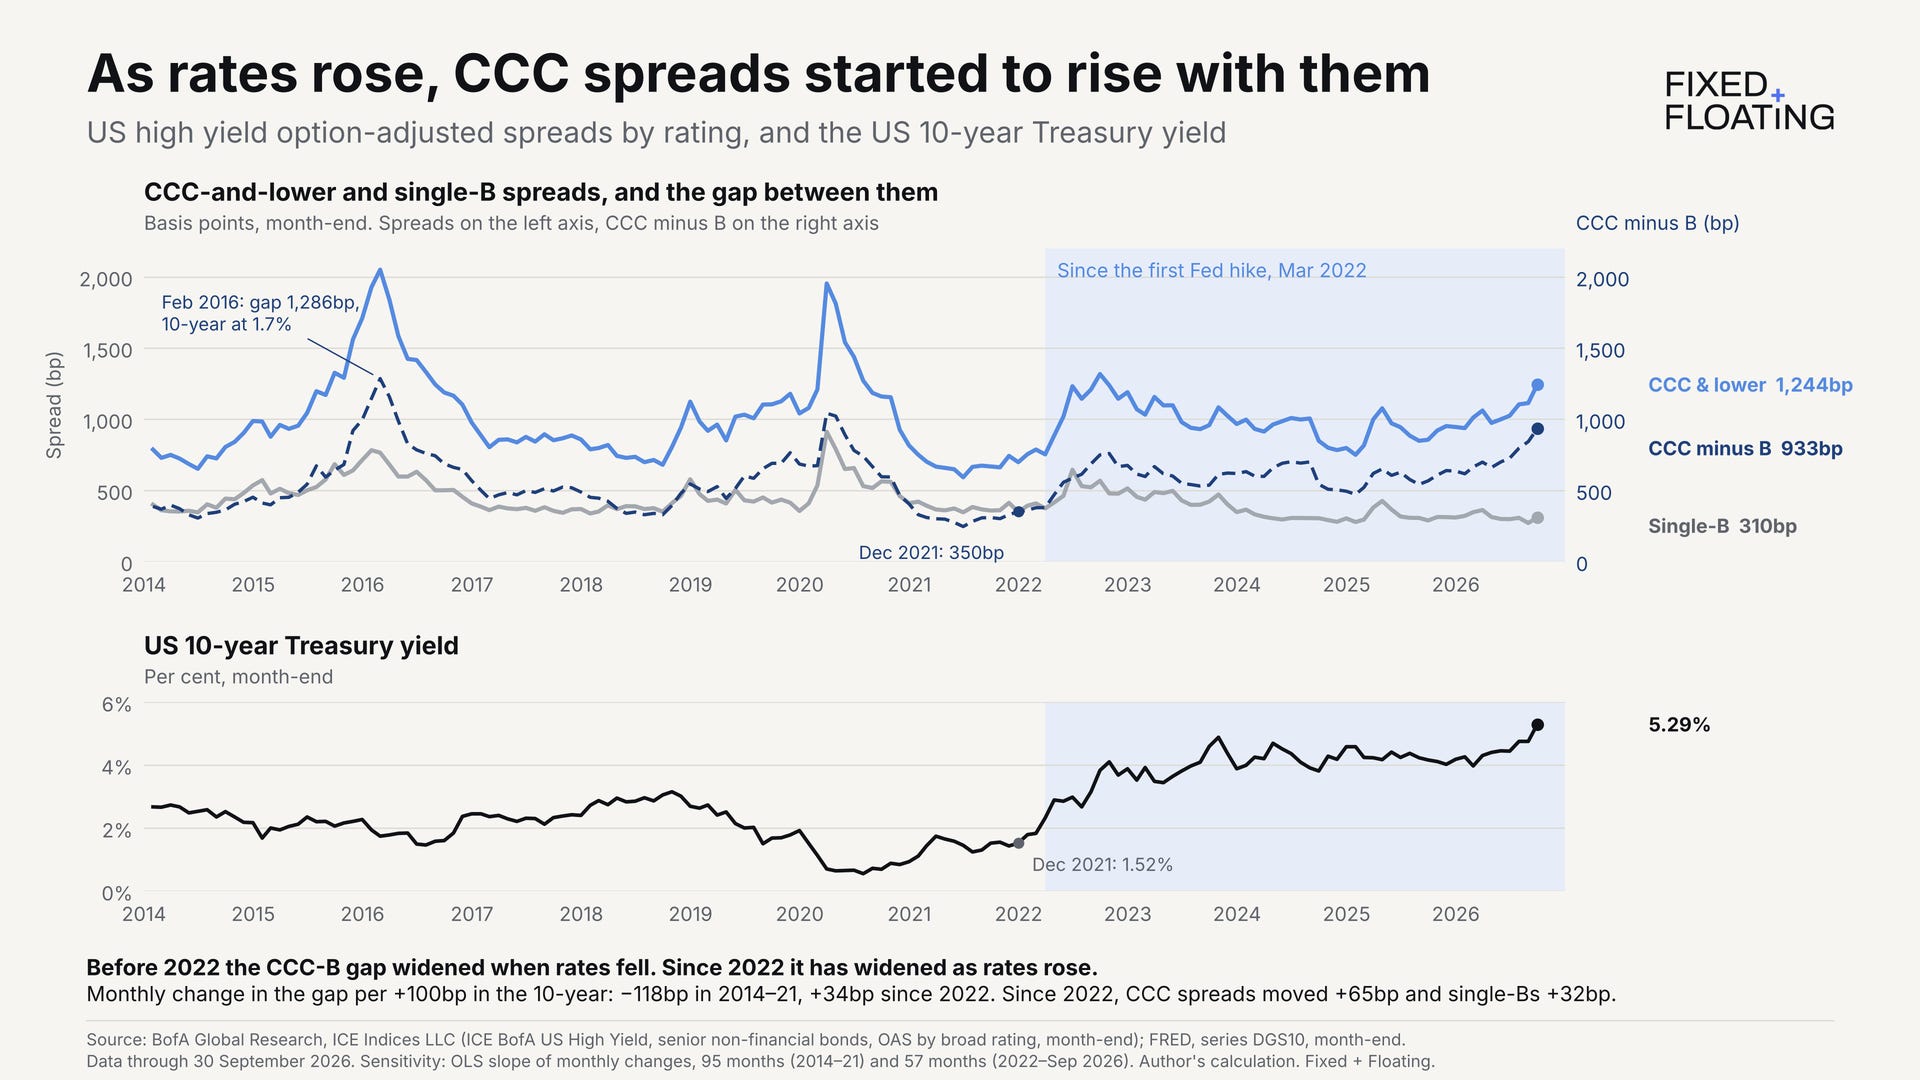
My interpretation is narrower: the divergence reflects, in part, the repricing of a segment of leveraged finance whose debt is no longer sustainable at the current cost of capital.
An increase in financing costs that forces a borrower levered at 7x into a restructuring may remain manageable for an otherwise comparable borrower levered at 3x. With public CCCs representing a small share of high yield, concentrated stress in that segment need not translate into comparable widening across the broader market.
Higher interest rates affect highly leveraged capital structures through two channels:
A higher discount rate reduces enterprise value, holding projected cash flows constant.
A higher all-in financing rate increases cash interest expense when floating-rate debt resets or fixed-rate debt is refinanced, reducing free cash flow.
Lower enterprise value erodes asset coverage. Higher interest expense reduces the amount of debt the business can sustainably service. The impact depends on leverage, cash generation and the timing of refinancing—not the rating alone (e.g. Virgin Media).
A highly leveraged borrower with negligible or negative levered free cash flow can require a debt reduction after a relatively small increase in financing costs. A borrower with lower leverage and stronger cash generation can absorb the same increase. My argument is that these rate-sensitive capital structures are concentrated in the CCC bucket, not confined to it.
Sector-specific operating pressures and liability-management exercises also matter. They can interact with the financing-cost mechanism described here, but this piece does not attempt to quantify their separate contributions to the CCC differential.
In XAIA’s Q1 2024 quarterly letter, which I co-authored, we argued that higher rates would keep the CCC differential elevated. The letter identified both valuation losses and rising financing costs as pressures on highly leveraged borrowers. The following piece further develops those mechanisms and their implications for credit analysis.2
For whom the spread tolls — some background on CCCs
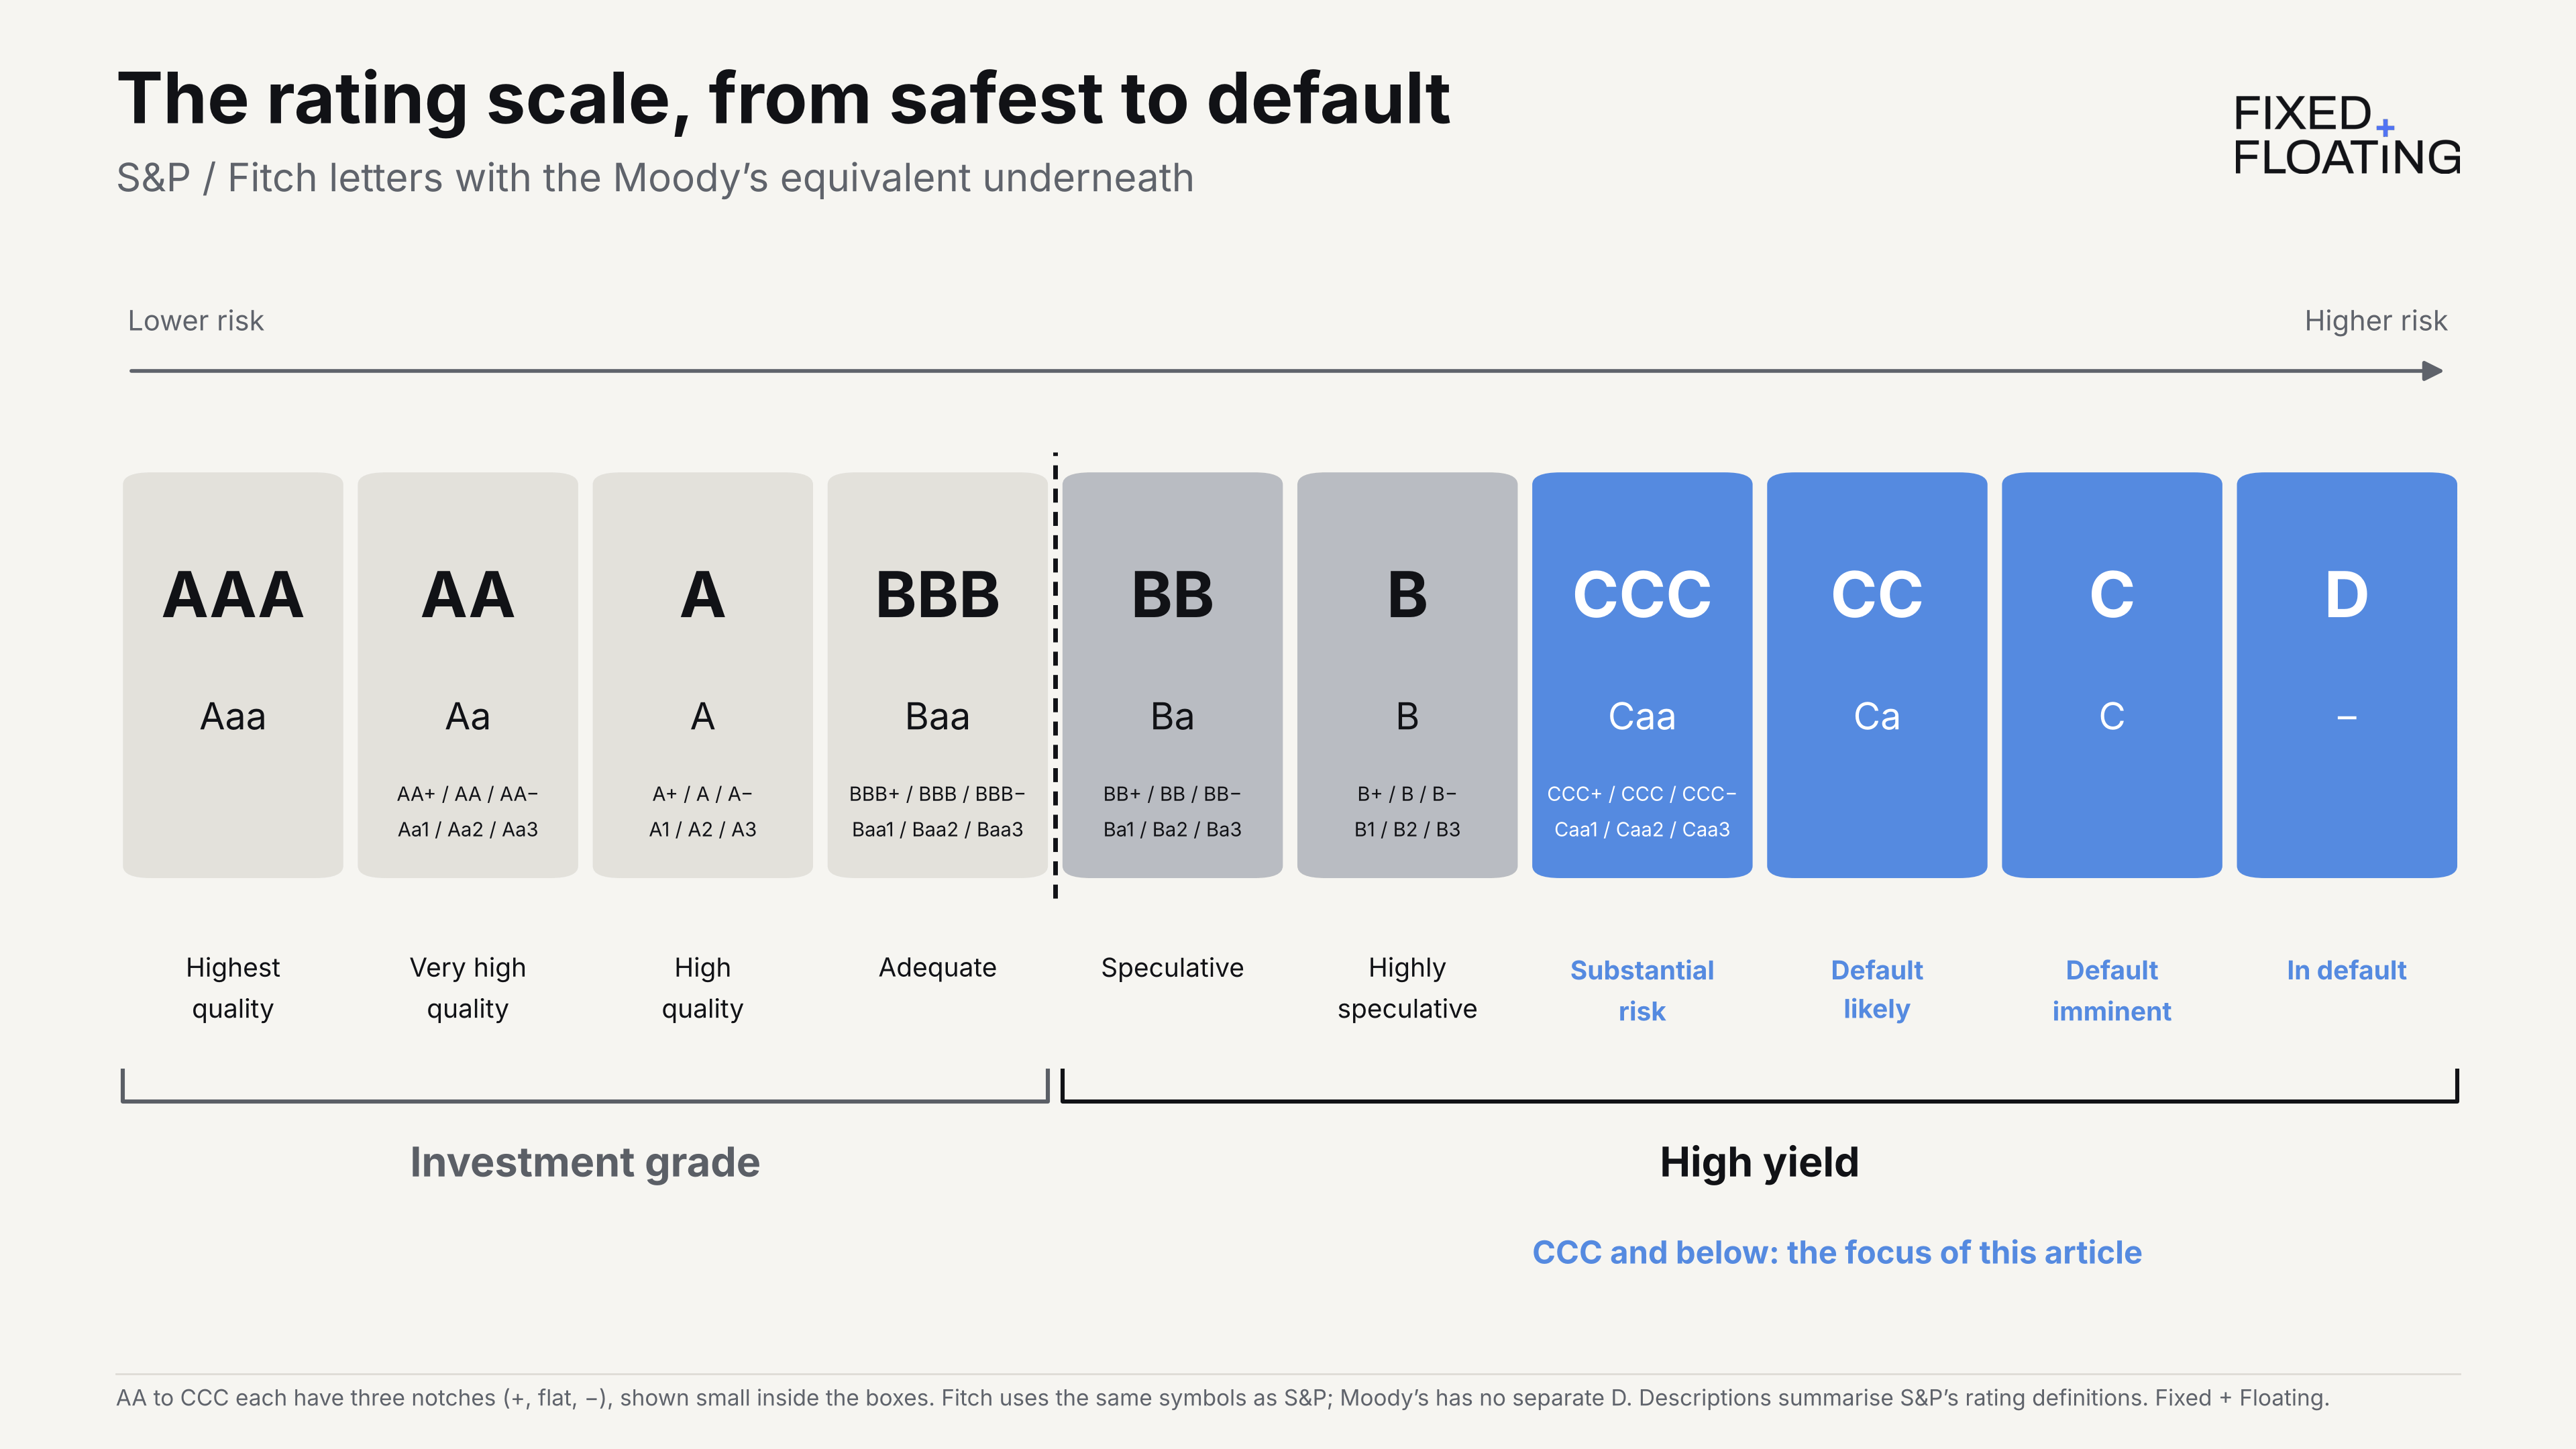
CCCs sit near the bottom of the high-yield ratings scale. A CCC rating can reflect operating weakness, excessive leverage or subordination (subordinated instrument rated CCC and more senior instrument rated BB).
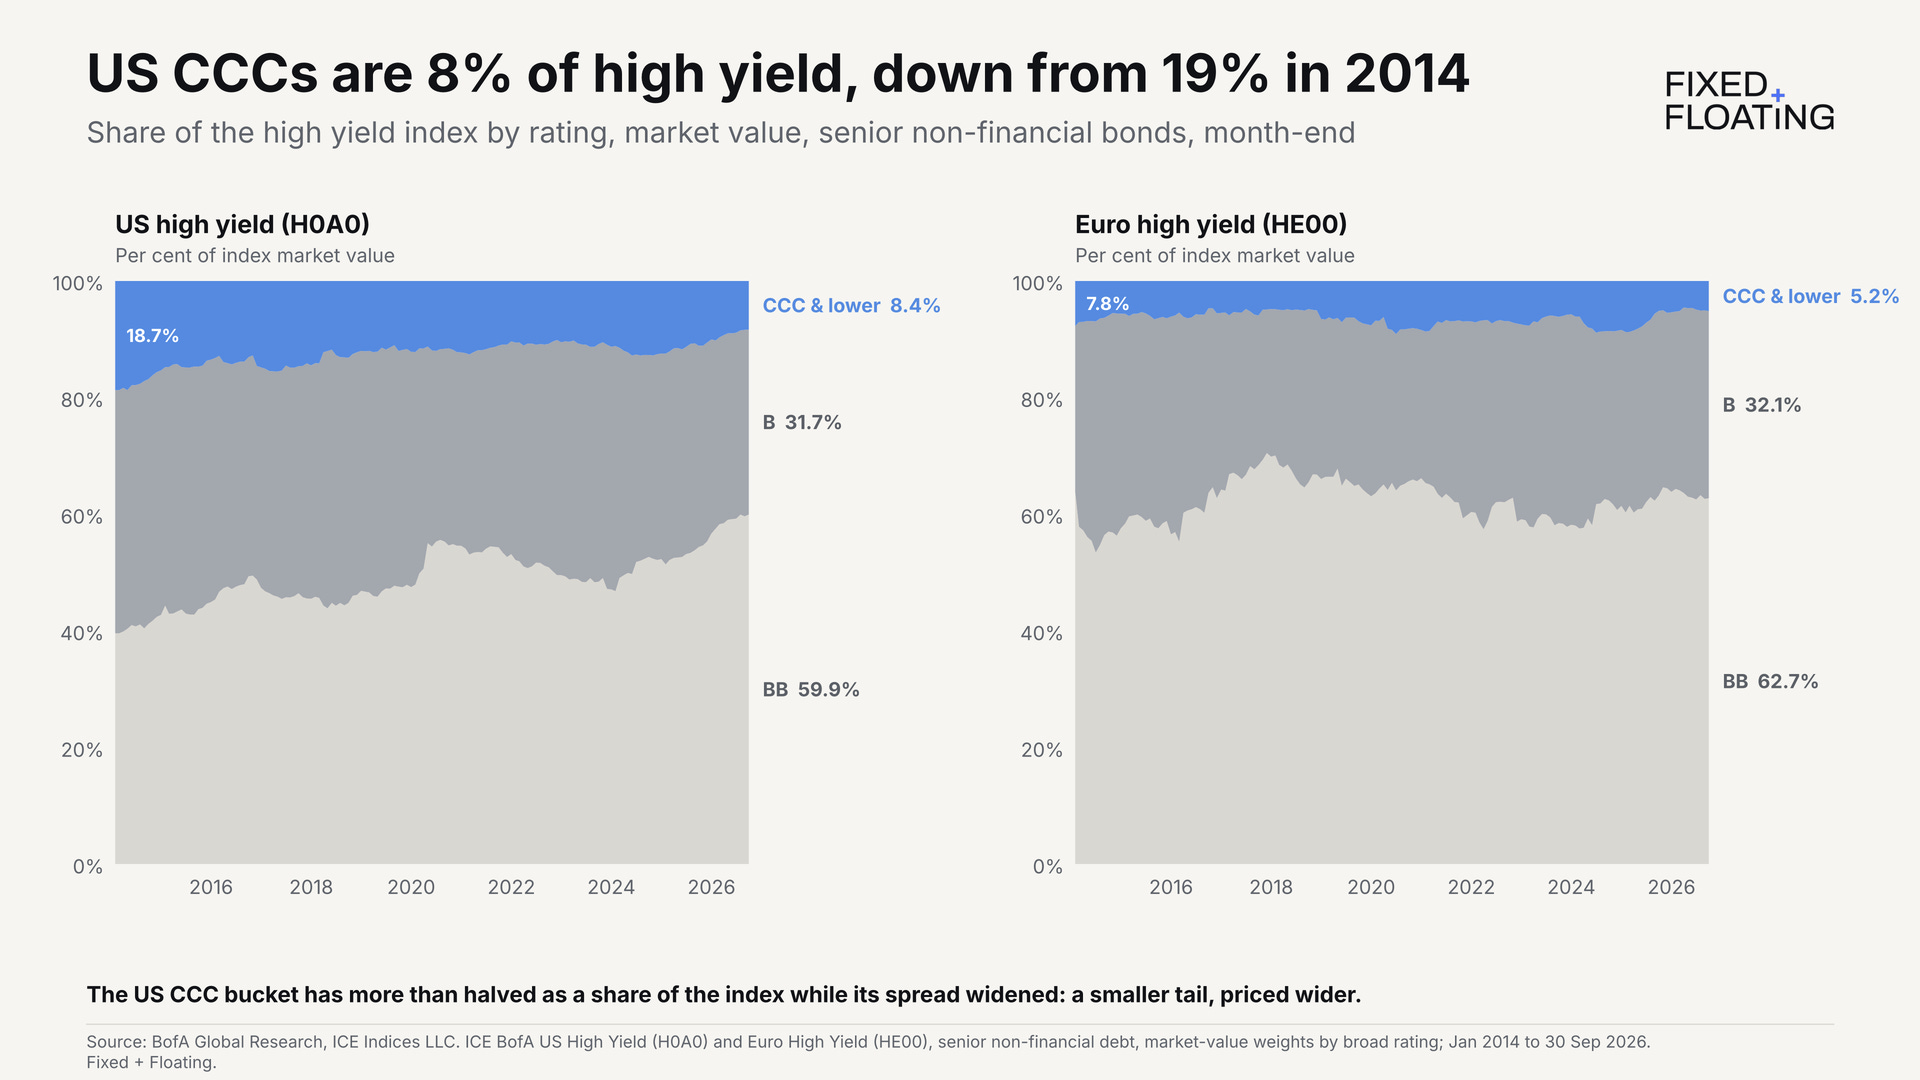
The CCC bucket is also much smaller than it was. Its share of the US high-yield index fell from 19% in January 2014 to 8% at the end of September 2026, while its spread widened. These are market-value weights: part of the decline reflects lower bond prices rather than fewer CCC issuers.¹
Historically, CCC spreads often widened when government yields fell because both reflected weaker growth. Falling earnings increased default risk, while government bonds rallied as investors sought safety and priced in monetary easing. Stronger growth could produce the reverse: rising yields alongside tighter credit spreads.
The highly leveraged structures built during the zero interest rate period now face an additional constraint. Their debt was sized against lower financing costs. Higher rates reduce the amount of debt their cash flows can sustainably service, even if operating performance holds up.²
These borrowers remain exposed to weaker growth. But stronger growth provides less protection if the improvement in cash generation is insufficient to offset higher financing costs induced by overall higher interest rates.
The favorable outcome is disinflation with resilient growth: financing costs decline without a material reduction in operating cash flow.
If rates instead fall because growth deteriorates sharply, weaker earnings and wider credit spreads can offset the benefit. The old pattern—falling government yields and widening CCC spreads—can reappear.
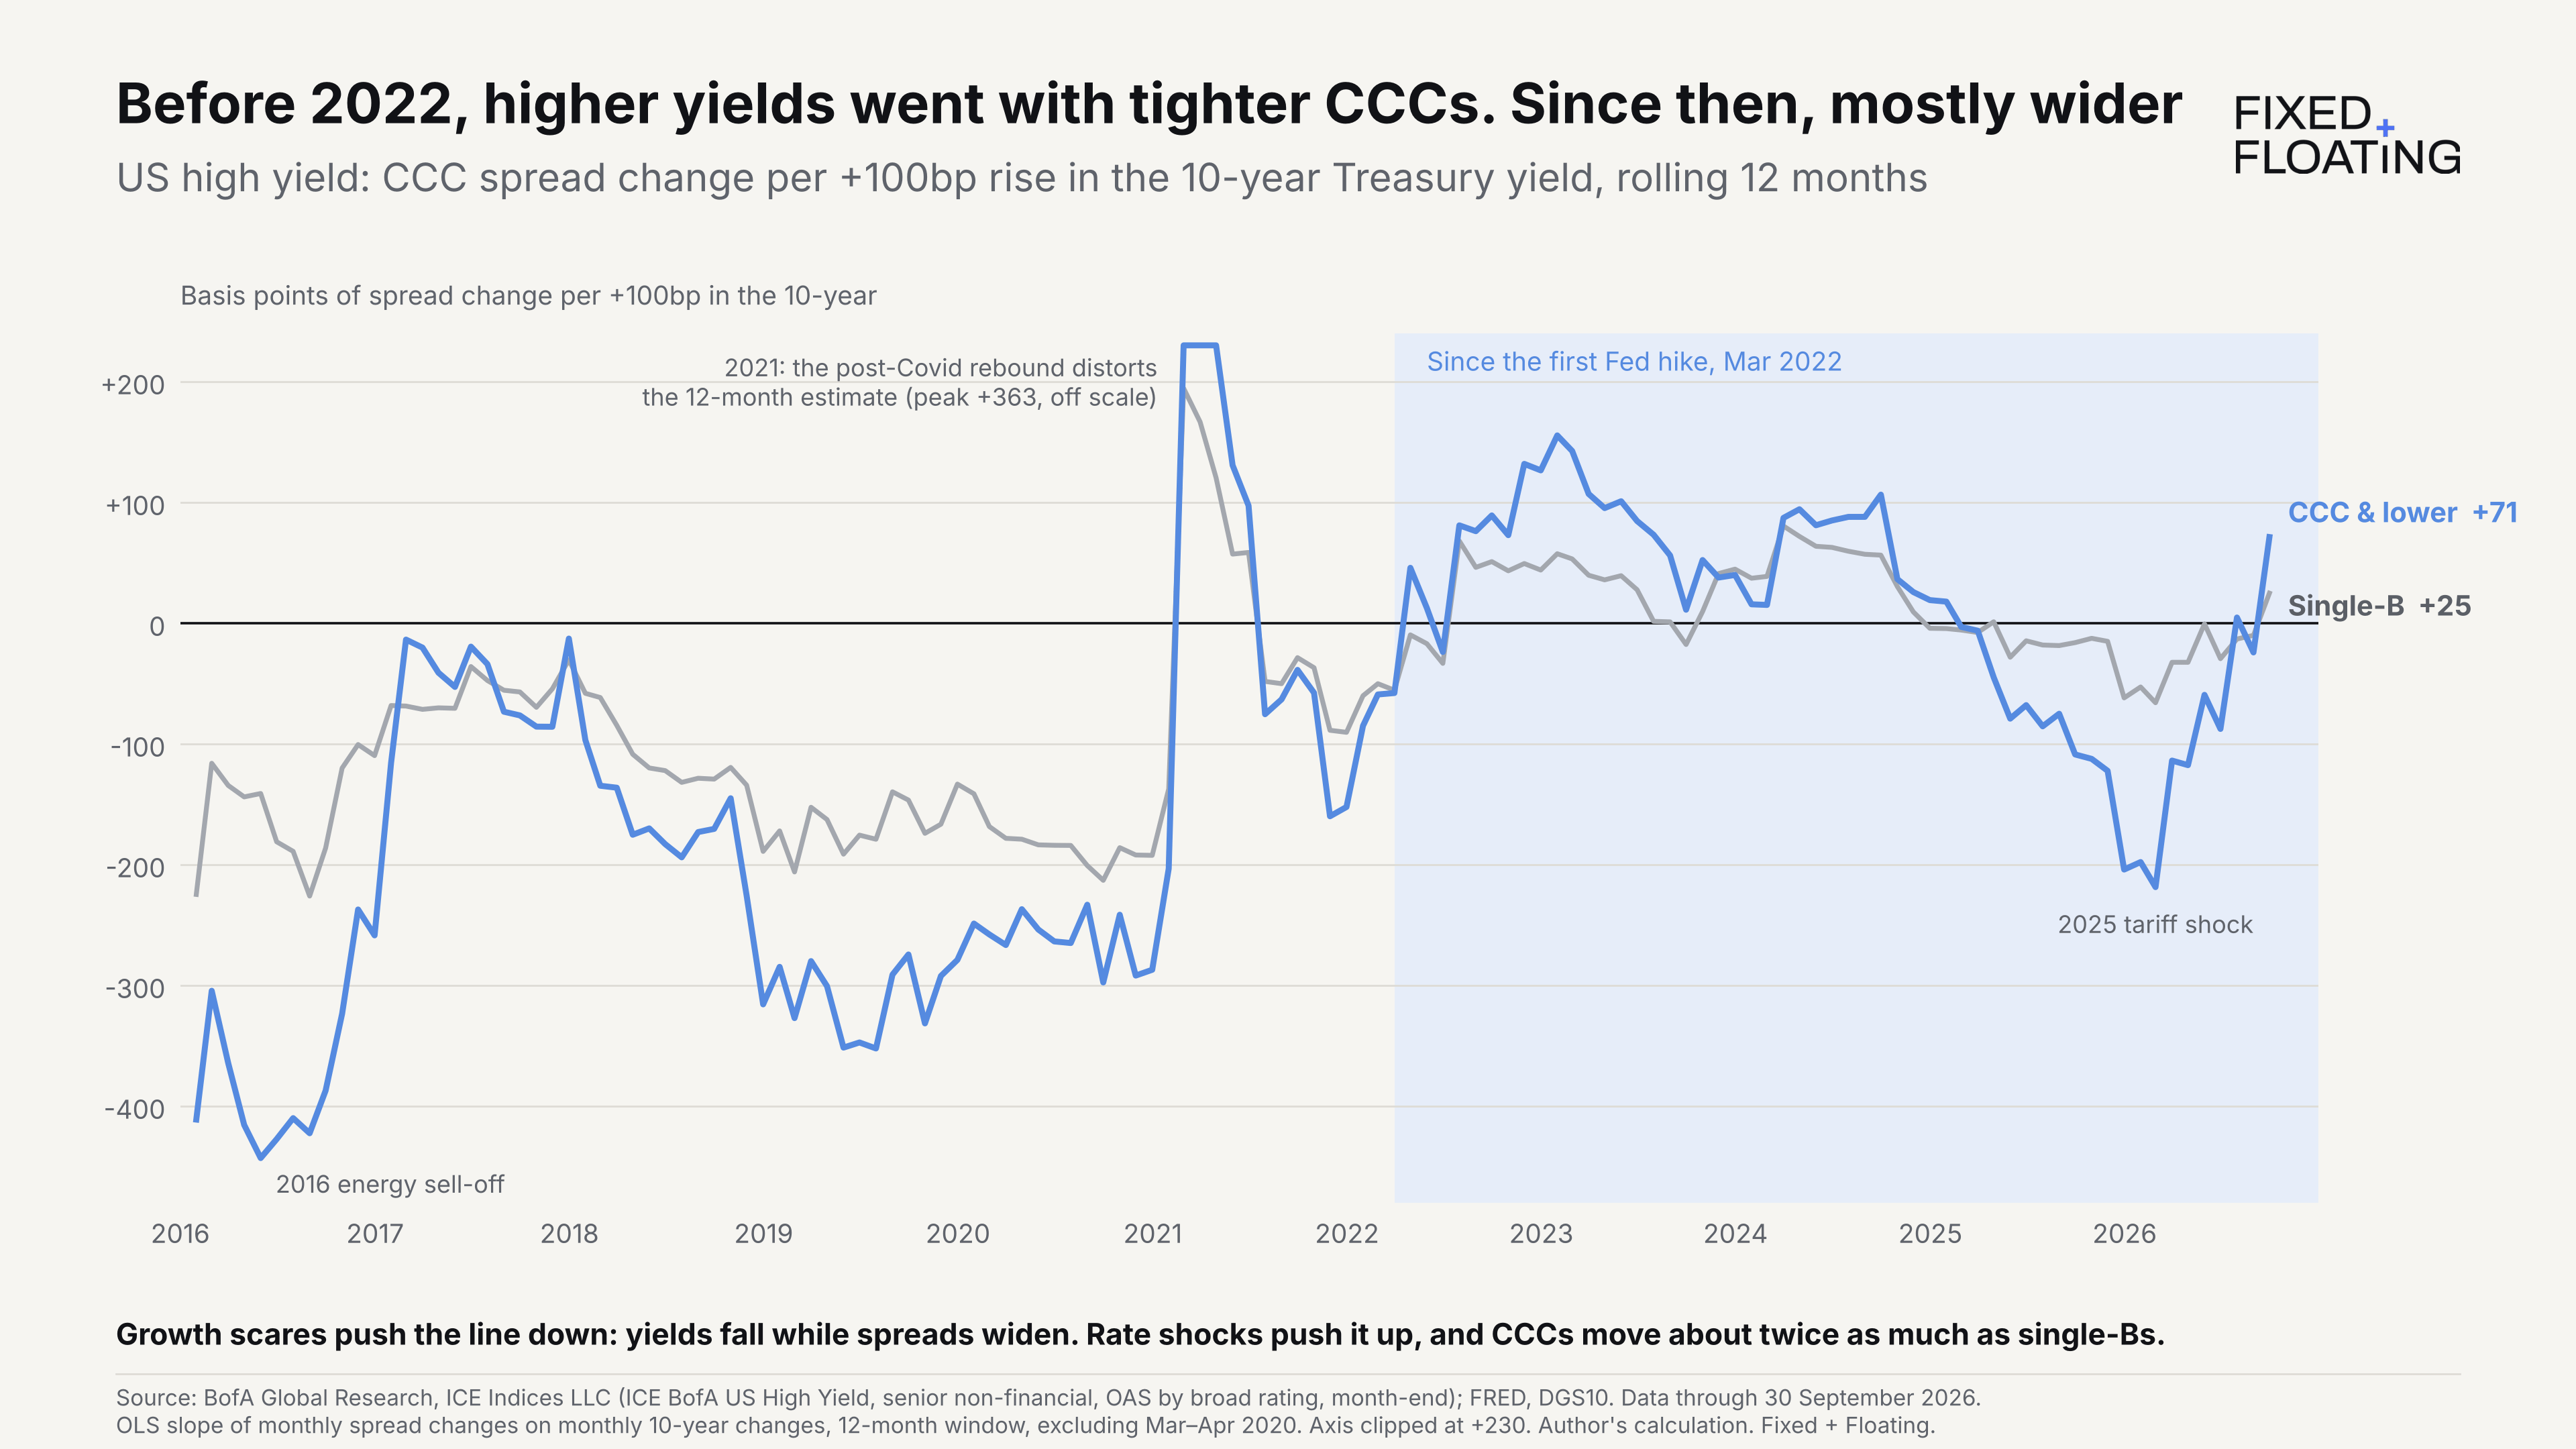
The spread–yield relationship also changed across the two samples. Before 2022, a 100bp increase in the 10-year Treasury yield was associated with an estimated 118bp narrowing of the CCC-minus-B differential. Since 2022, it was associated with 34bp of widening.³
These are regressions of monthly changes, not isolated rate shocks. The rolling estimates also turn negative during part of the later period (tariff shock). The result is consistent with financing costs becoming more important for highly leveraged borrowers; it does not establish that rates caused the CCC widening. The rating buckets are not fixed portfolios: rating migration, defaults and changes in issuer and sector weights can also affect the observed differential.
Altice illustrates how legacy financing can preserve near-term liquidity while leaving the long-term debt burden unresolved.
Die another day — Altice’s liquidity buys time, not deleveraging
Altice USA illustrates how a borrower can address near-term maturities without resolving an unsustainable capital structure.
In February 2024, S&P assessed Altice’s liquidity as adequate and noted that roughly 86% of its debt was fixed-rate, including floating-to-fixed swaps. Its assessment identified no substantial maturity wall until 2027. Legacy financing limited the immediate increase in interest expense and provided time to execute the turnaround.⁴
But liquidity did not establish debt sustainability. In May, S&P downgraded Altice to CCC+ on capital-structure sustainability concerns. On approximately $25 billion of debt, an increase in the average interest rate from roughly 7% to 9% would add approximately $500 million of annual interest expense. That would absorb approximately $500 million of estimated free operating cash flow—even under an assumption that capex was reduced to about $1.2 billion.⁶
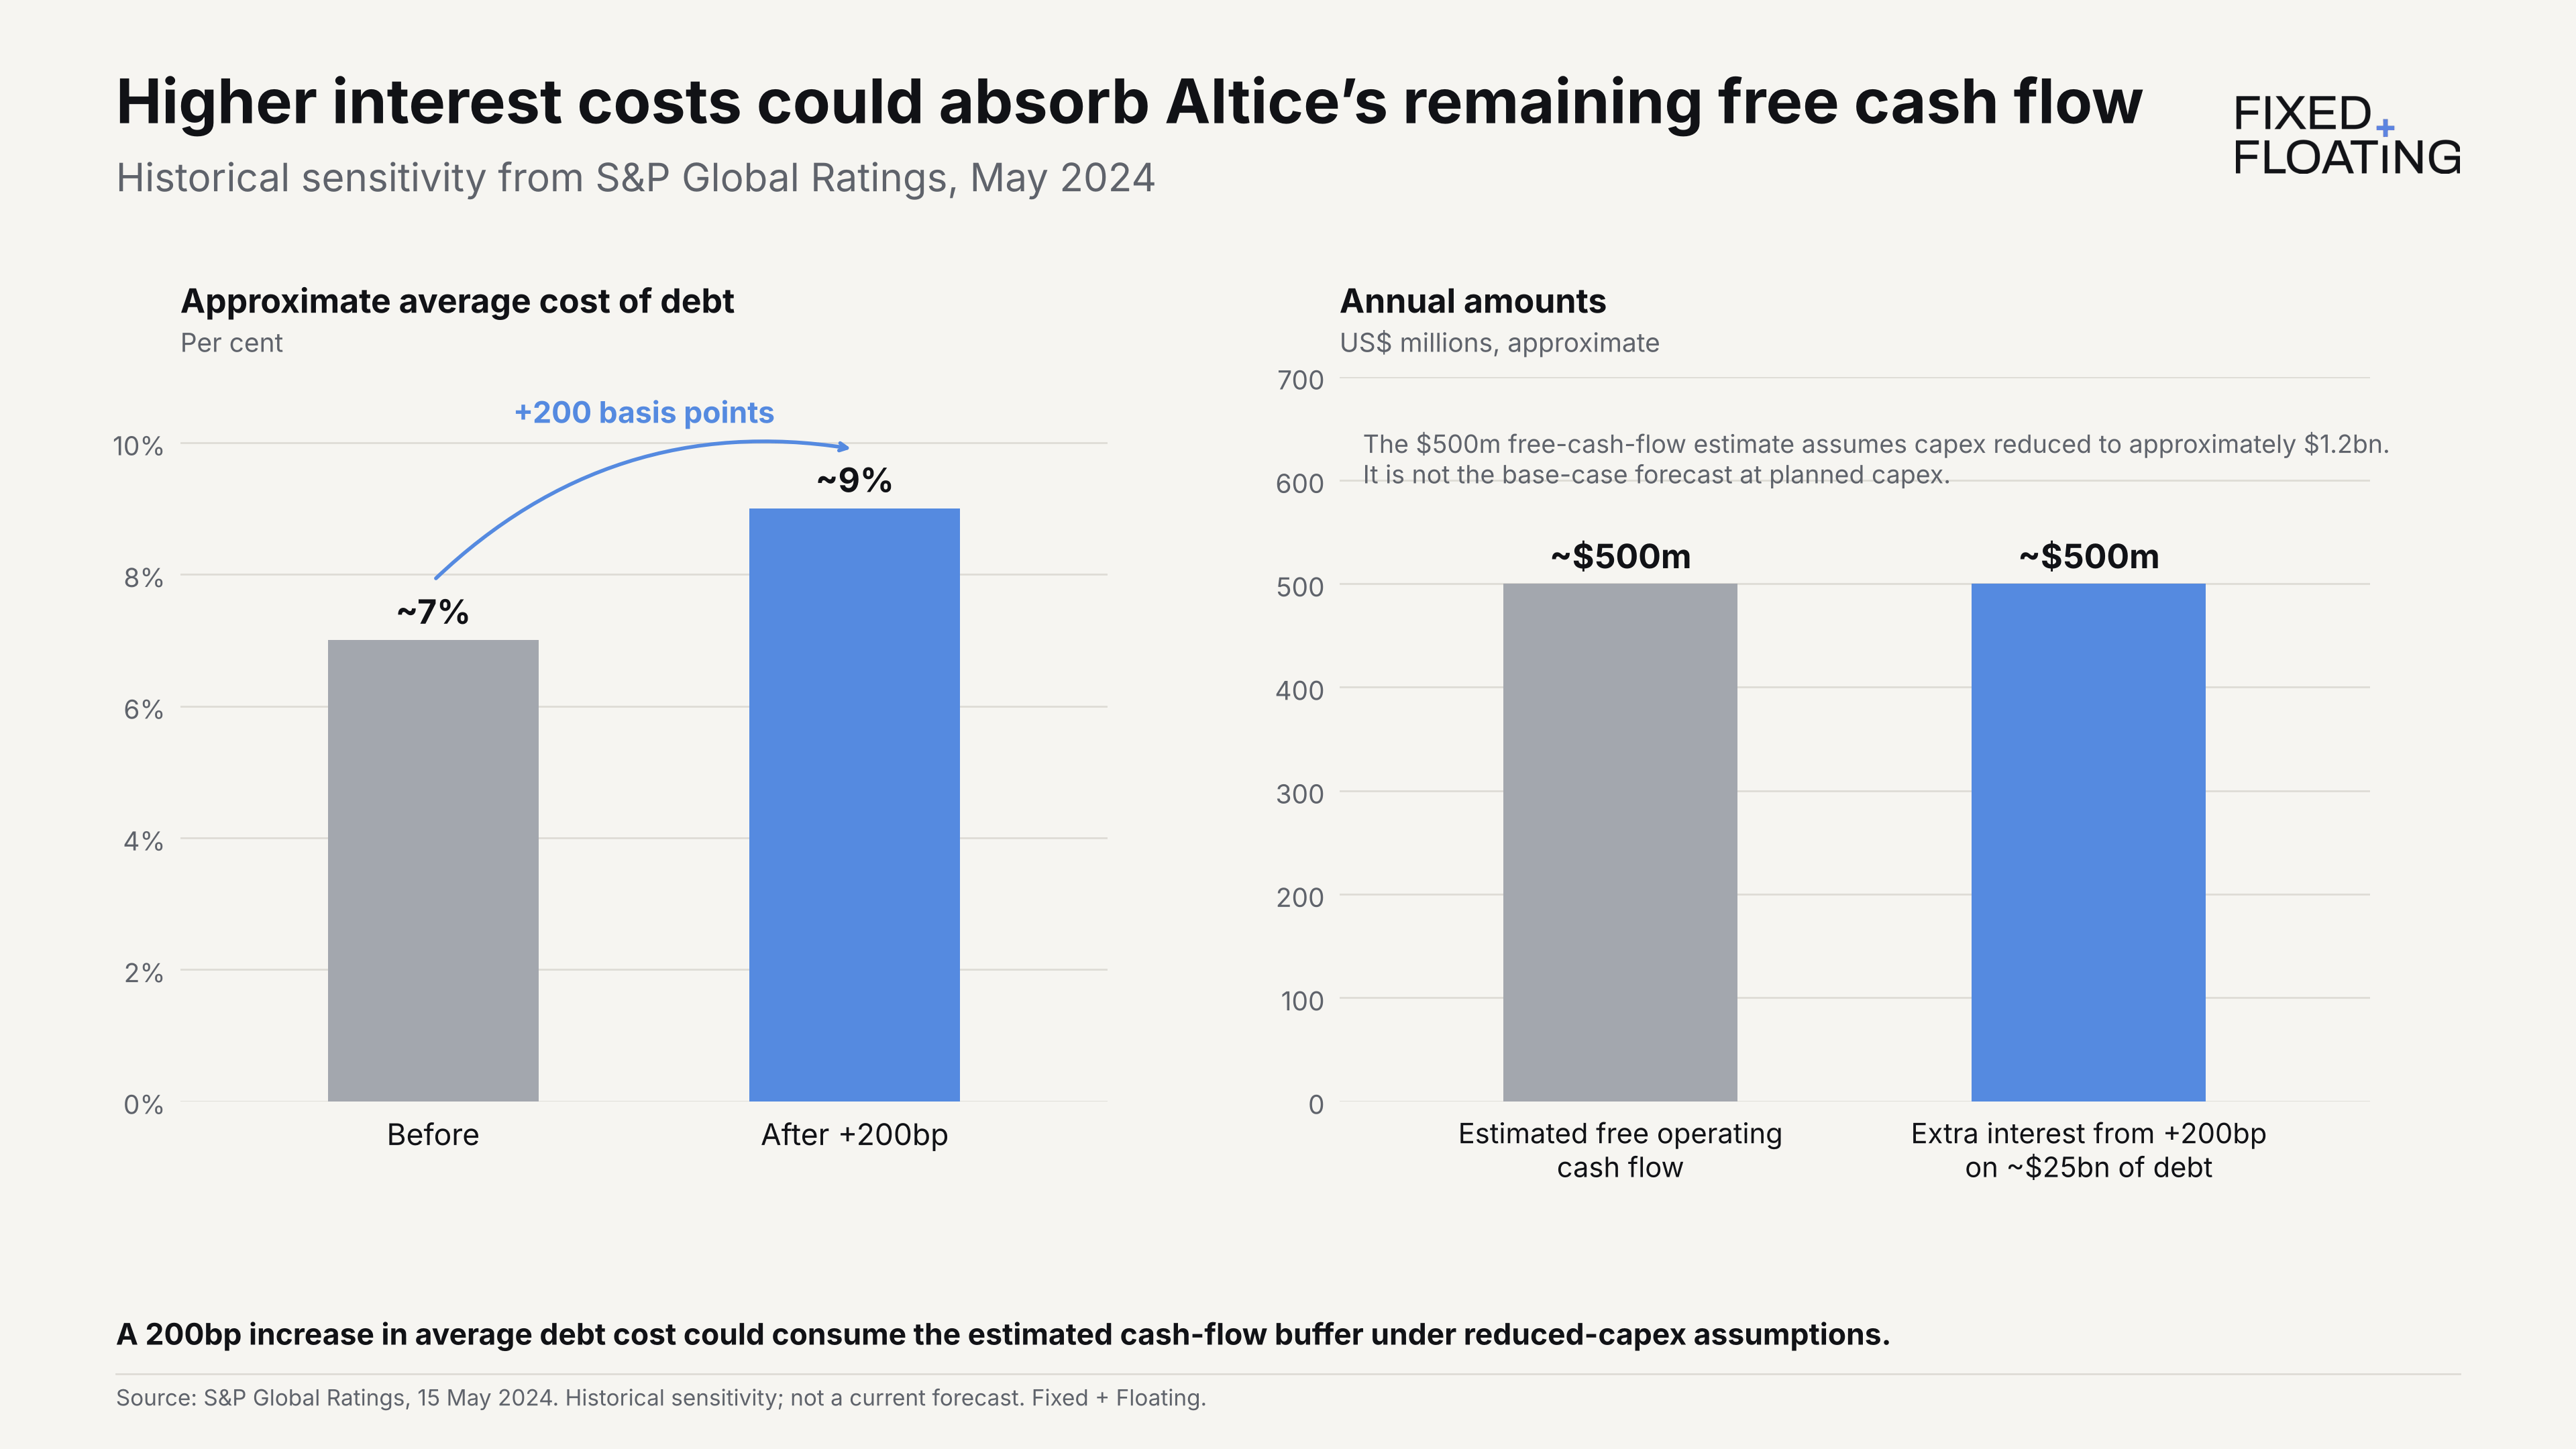
Average yields on traded instruments reflect the gap between the existing interest cost and the return investors required. S&P cited yields of approximately 12–16% on guaranteed notes and 23–27% on unsecured notes. These were not executable refinancing offers, but they showed how far market pricing had moved above the existing blended cost of debt.⁶
Altice had addressed its near-term maturities. However, it cannot refinance the whole capital structure at a sustainable cost for the time being.
Altice also faced declining earnings, competition and substantial capital expenditure. Higher financing costs compounded those operating pressures: the business had little room to absorb either weaker cash generation or a higher interest bill.
The capital-structure problem remained unresolved. In June 2026, the renamed Optimum Communications announced plans to pursue a comprehensive restructuring of CSC Holdings’ debt.¹⁸ S&P subsequently downgraded the company to CCC, citing approximately $6.2 billion of 2027 maturities and the likelihood of restructuring.⁷
The distinction is between postponing repayment and restoring debt capacity. Legacy financing and maturity extensions can preserve liquidity, but if the business cannot service the existing debt at its replacement cost, time alone does not close the gap.
Honey, I shrunk the debt capacity — higher refinancing rates and cash-flow coverage
A central task in corporate credit analysis is to estimate how much debt a business can sustainably service over the life of the loan. The first channel through which higher interest rates affect credit is a reduction in debt capacity: with cash generation unchanged, the business can service less debt.
Every capital structure is different. For the calculations below, we simplify things and use one class of debt, with all creditors ranking equally.
Consider a company with EBITDA of 100 and gross debt of 600 and no cash: 6.0x leverage.
After capital expenditure, working-capital requirements and cash taxes, assume it generates 60m cash before cash interest. We hold cash taxes constant and exclude scheduled amortisation, financing fees and the incremental interest tax shield.
For this analysis, cash-flow interest coverage is:
The numerator deducts reinvestment and taxes before assessing interest coverage. This is more useful for our purpose than EBITDA alone, particularly for capital-intensive borrowers. Cash interest-coverage definitions vary, but i stick to this version to account for varying capital structures.⁹
At an 8.5% all-in cash interest rate, annual interest on 600 of debt is 51. Coverage is 1.18x and post-interest cash flow is 9.
At 11%, interest rises to 66. Coverage falls to 0.91x and post-interest cash flow becomes negative 6.
We can calculate the amount of debt consistent with a specified coverage requirement:
Here, C is cash available before interest, k is required cash-flow interest coverage and i is the all-in cash interest rate.
Use an illustrative 1.25x coverage requirement throughout. At an 8.5% rate, 60 of cash supports approximately 565 of debt. At 11%, it supports approximately 436.
The existing 600 debt balance therefore exceeds the amount supported at 1.25x coverage in both cases. At 8.5%, the borrower still generates positive post-interest cash flow. At 11%, it cannot meet the interest bill from the assumed cash generation.
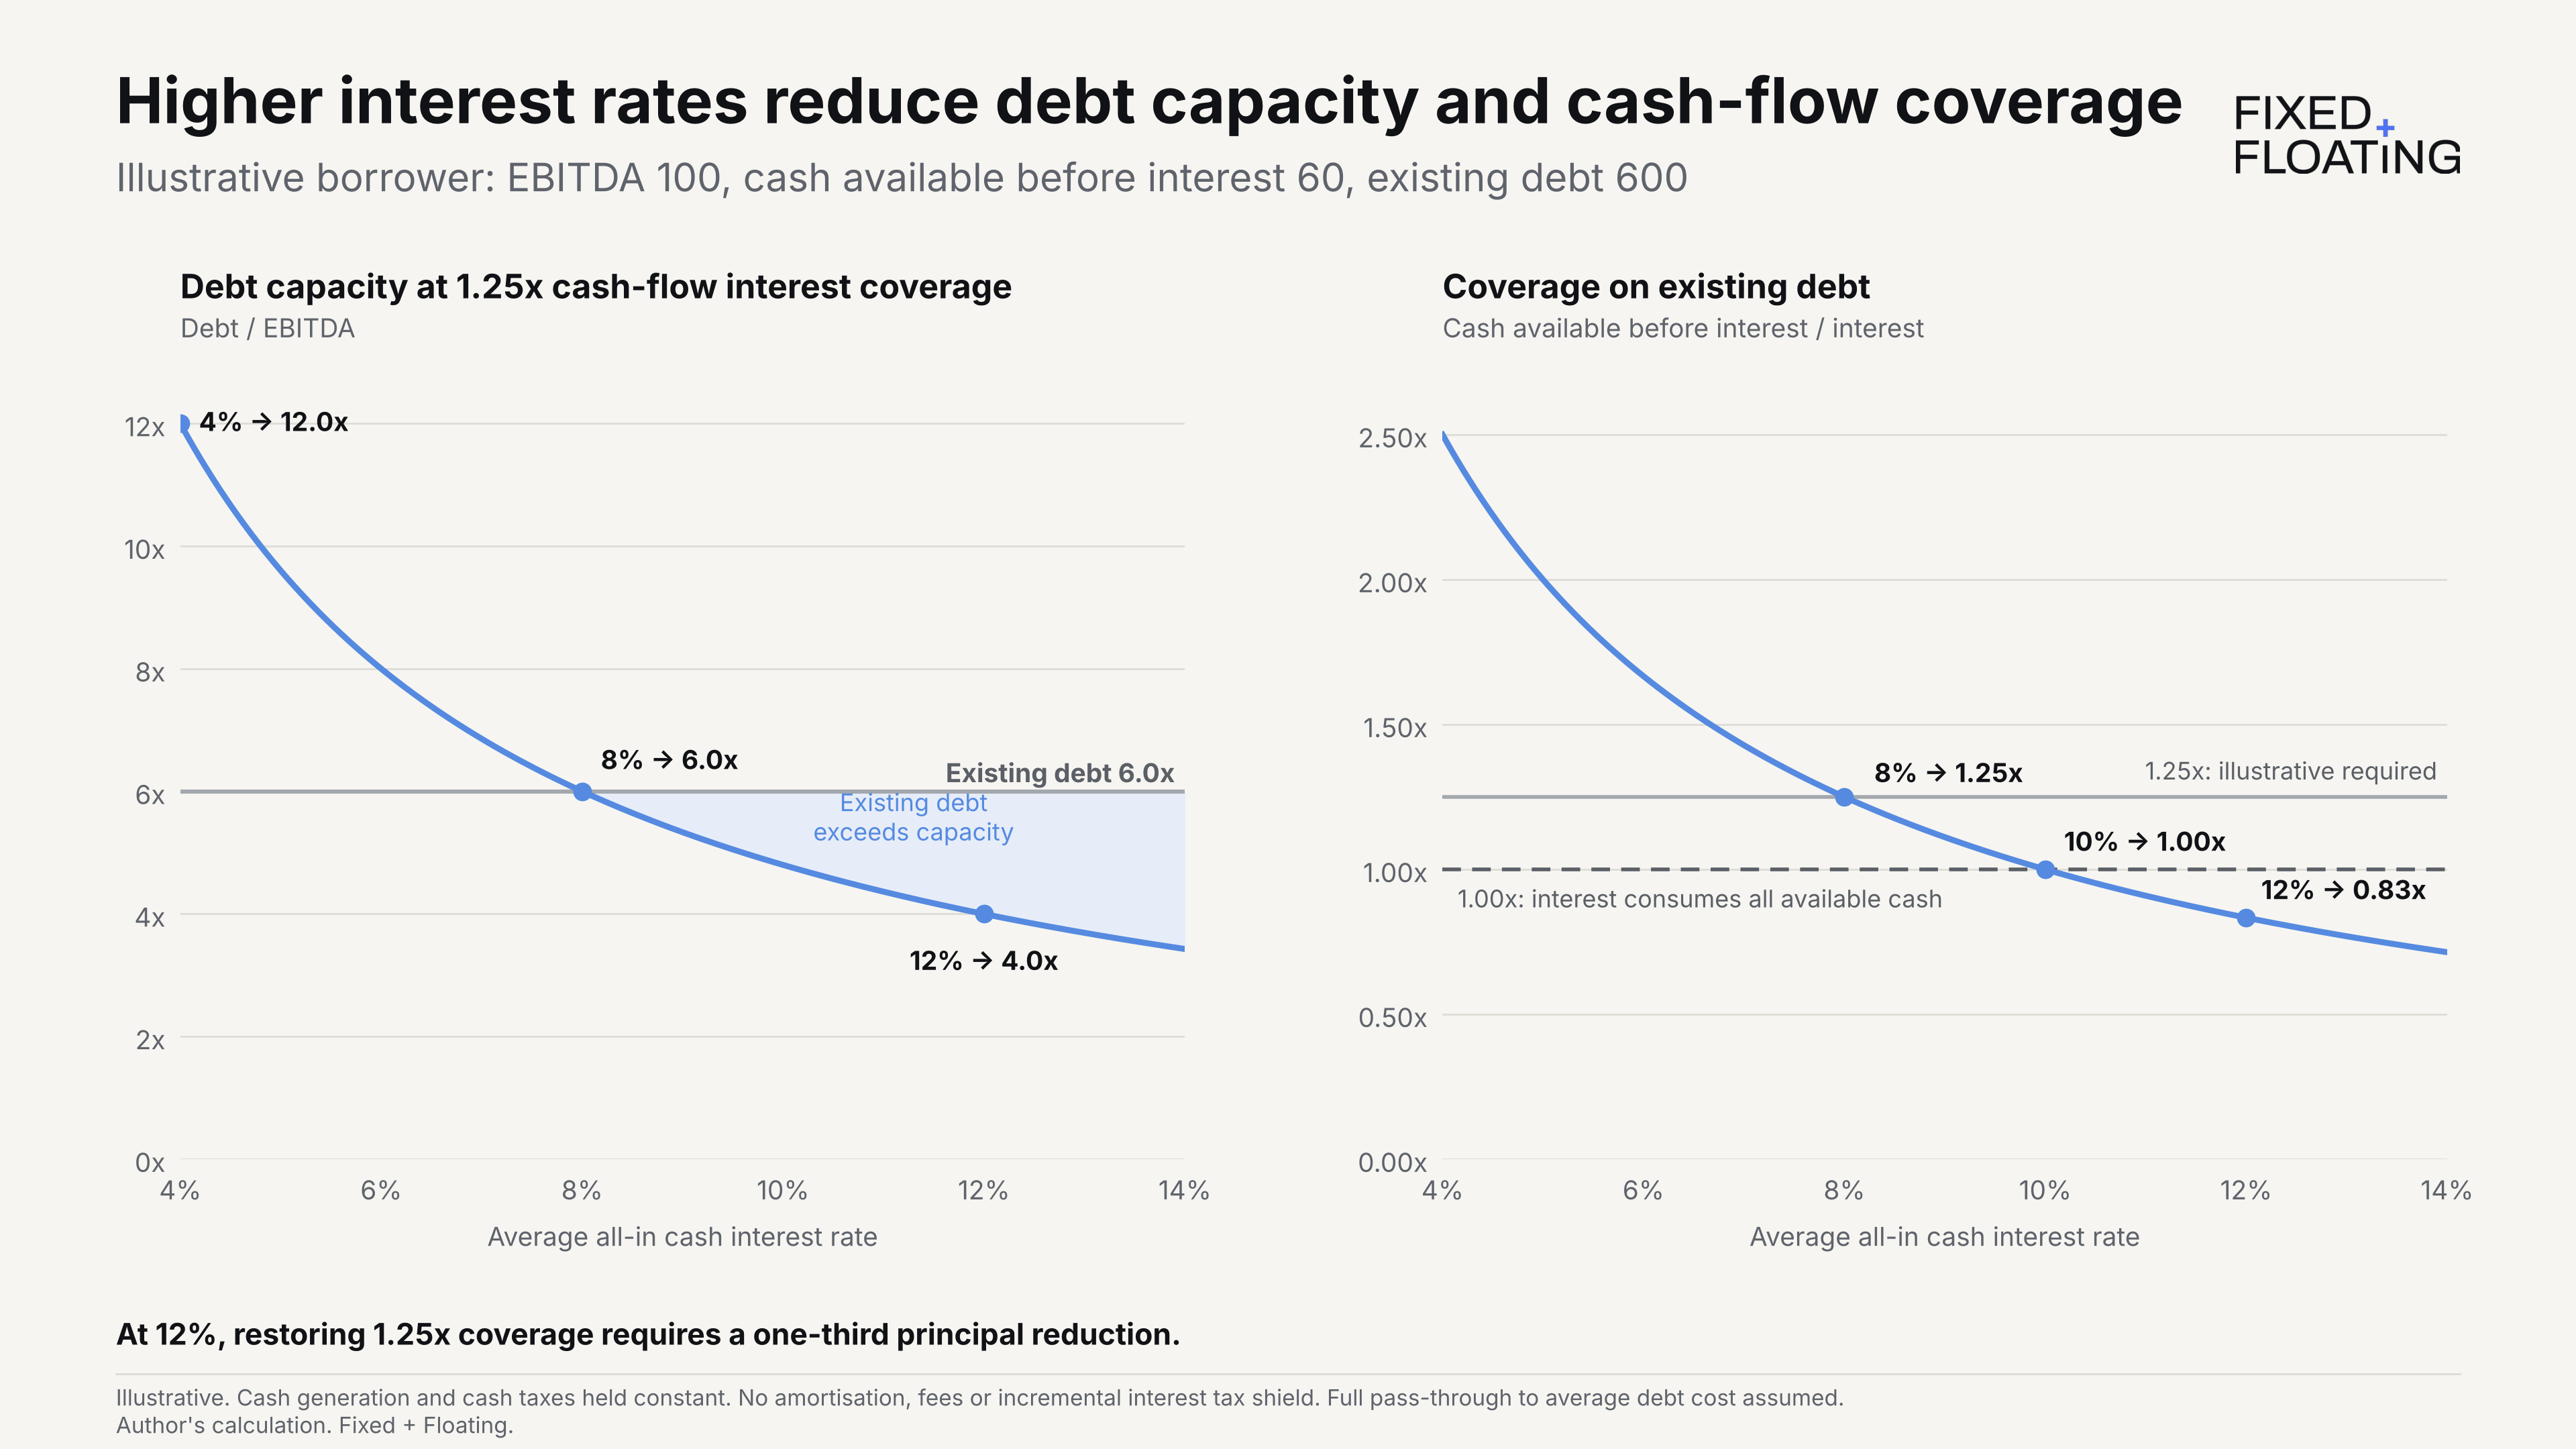
The continuous sensitivity makes the thresholds clearer. At an 8% rate, existing debt has 1.25x coverage. At 10%, interest consumes all 60 of available cash. At 12%, coverage falls to 0.83x, and restoring 1.25x coverage requires debt to decline to 400—a one-third reduction.
Debt capacity and cash-flow interest coverage both decline inversely with the financing rate.
Operating cash generation need not deteriorate for the capital structure to require deleveraging.
The 1.25x requirement is an illustrative assumption, not a refinancing threshold that applies across borrowers. A cyclical business with weakening earnings can be difficult to finance even at higher coverage. A business temporarily at 1.0x may retain access to capital if lenders expect a credible recovery and sufficient liquidity is available until then. The cash-flow outlook and its volatility determine how much weight to put on current coverage.
Interest deductibility can reduce cash taxes and soften the financing-cost increase. If the cash-tax forecast already incorporates the deduction, an additional shield would double-count it. Our illustration holds cash taxes constant and excludes that incremental benefit.
Dude, where’s my equity? — higher discount rates and asset coverage
The second channel is enterprise valuation.
The risk-free rate is a component of both the cost of debt and the required return on equity. Holding credit spreads, equity risk premiums and financing weights constant, a higher risk-free rate raises the business’s cost of capital. That higher required return reduces the present value of its operating cash flows.¹⁵
For a simple growing perpetuity:
Here, F₁ is next-period unlevered free cash flow, g is its long-term growth rate and r is the discount rate—the required return on the capital invested in the business. In a conventional enterprise DCF, this is the weighted average cost of capital, or WACC. It is not the risk-free rate alone.¹⁵
Holding projected unlevered cash flows and growth constant, a higher cost of capital mechanically reduces enterprise value. Debt principal remains unchanged, so debt-to-enterprise-value increases.
Assume next-period unlevered free cash flow of 56, growth of 2% and EBITDA of 100. This is a separate valuation sensitivity; the 56 represents next-period unlevered free cash flow, while the preceding interest-coverage example uses 60 of current cash available before interest.
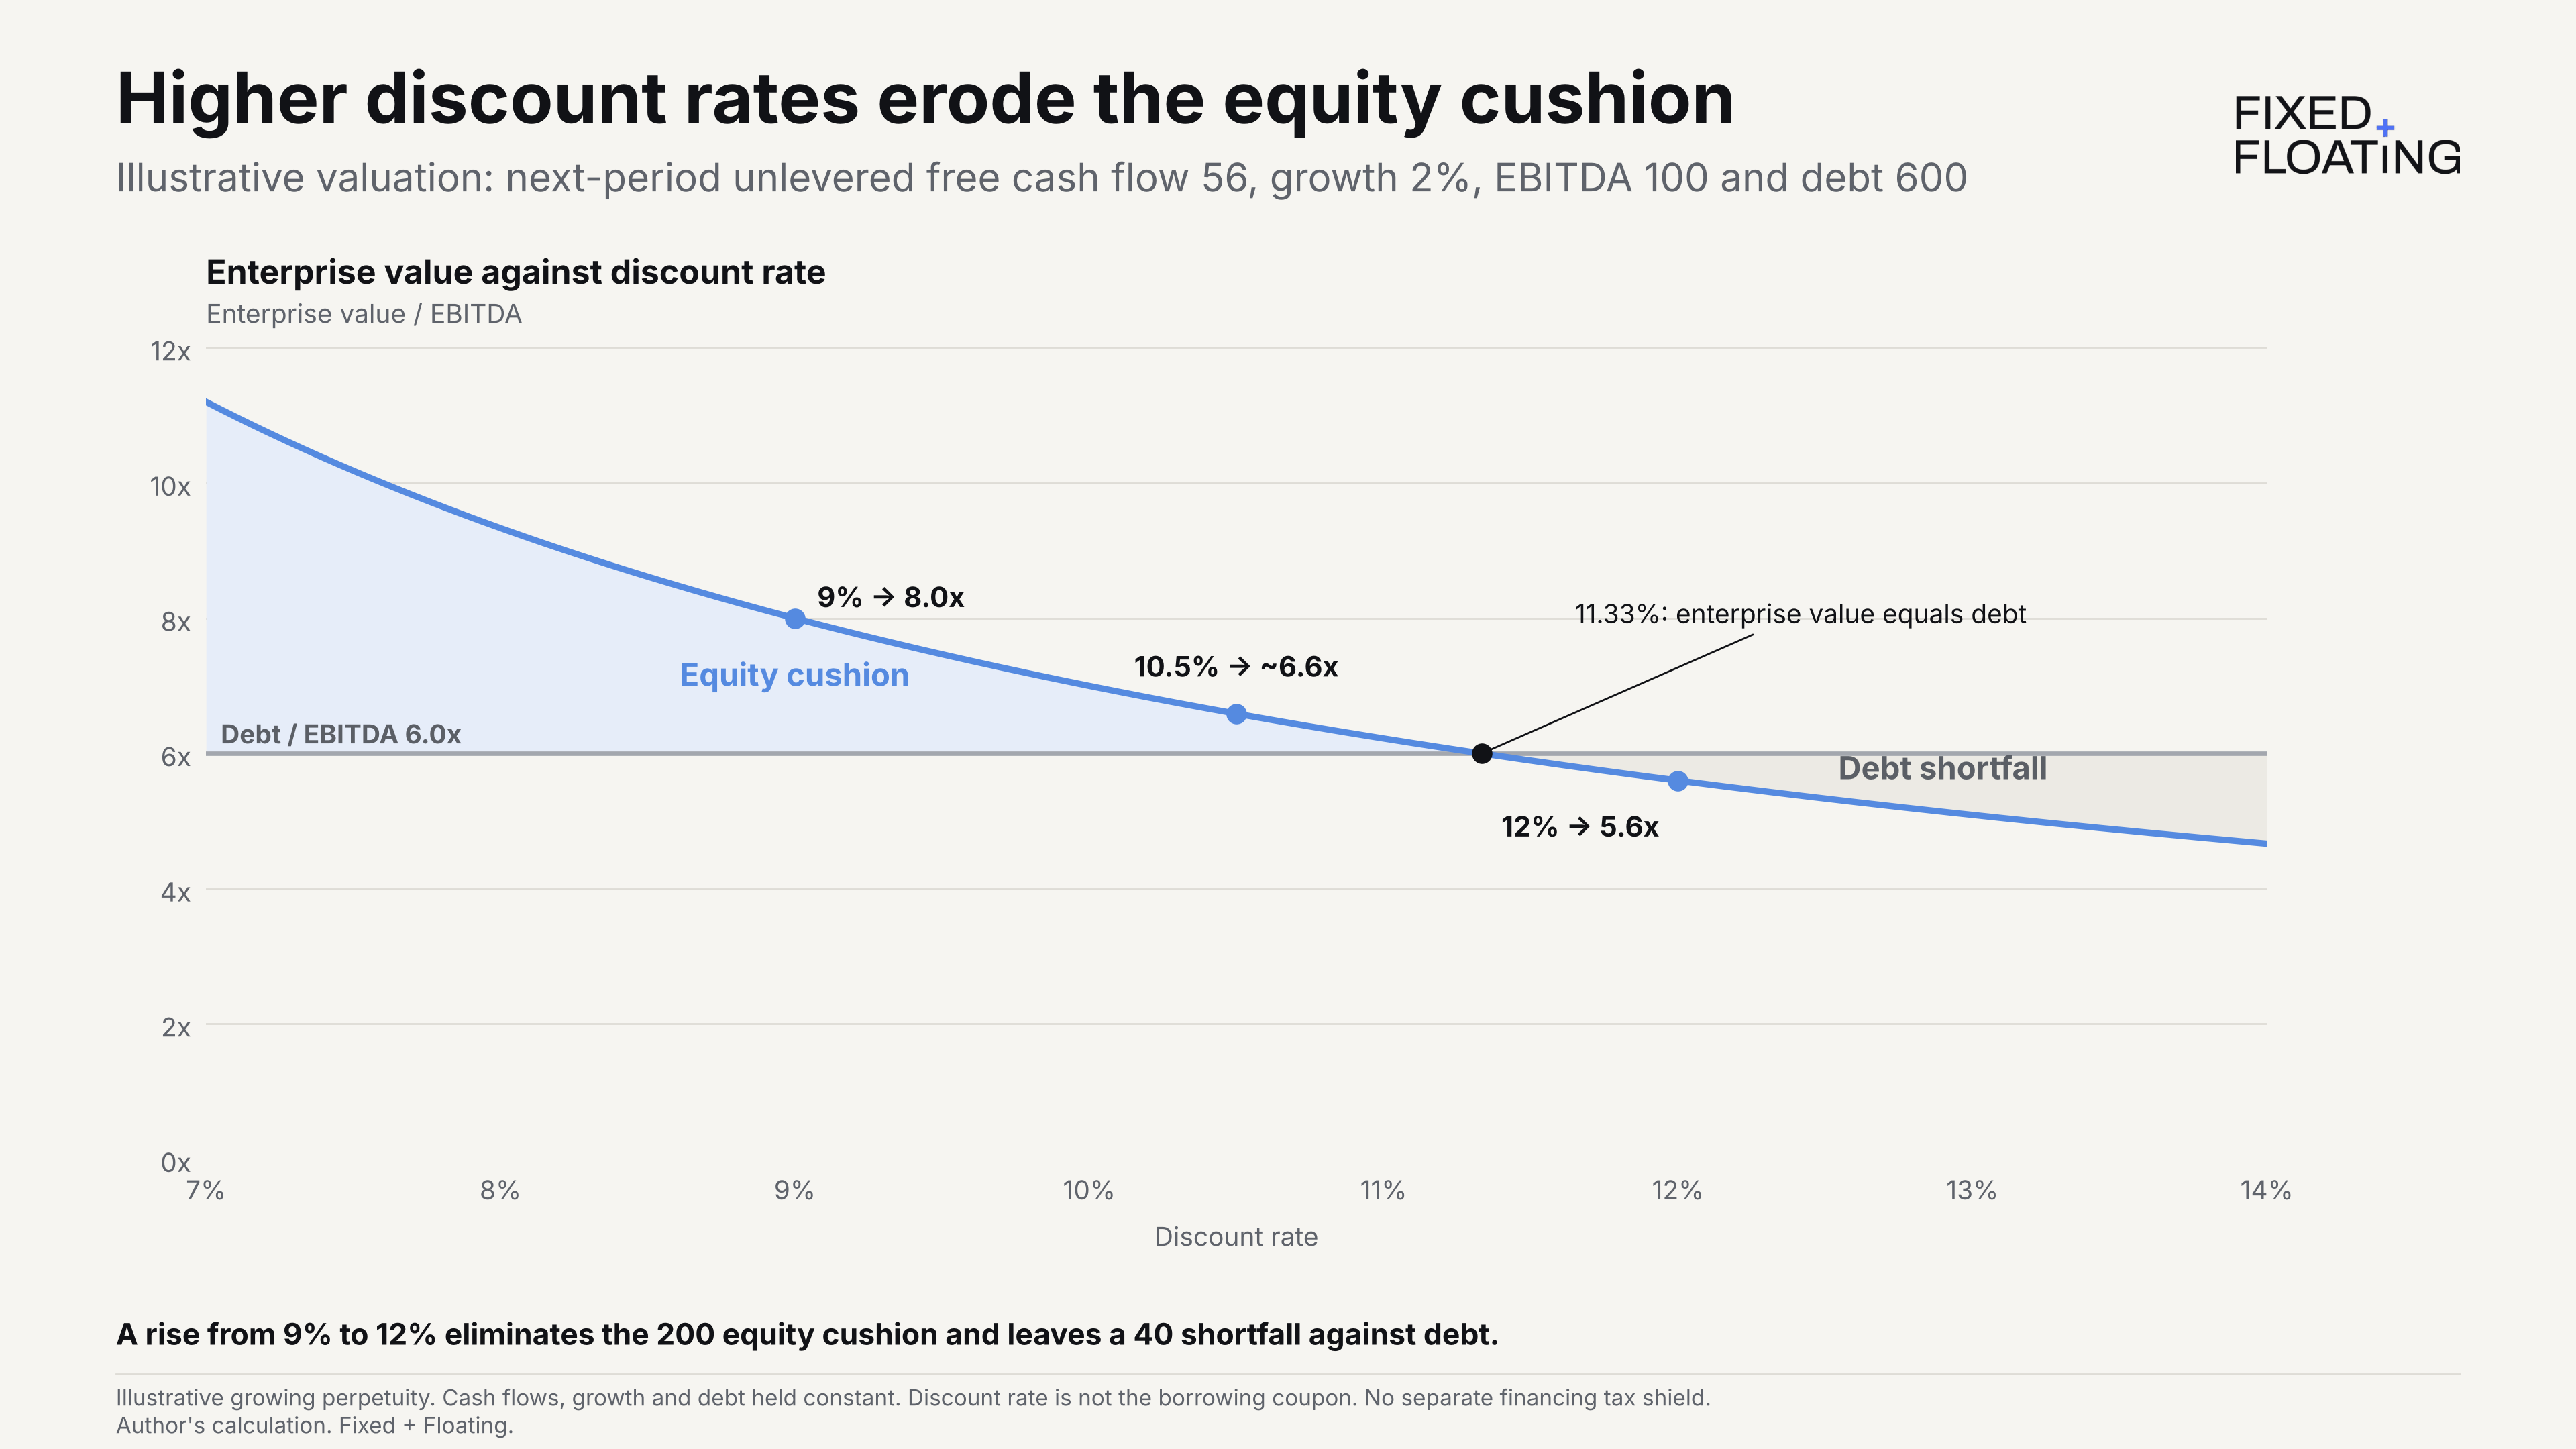
At a 9% cost of capital, enterprise value is 800. Debt of 600 leaves an equity cushion of 200.
Increasing the cost of capital to 10.5% reduces enterprise value to approximately 659 and removes about 71% of the equity cushion.
At approximately 11.3%, enterprise value equals debt. At 12%, it falls to 560, leaving a 40 shortfall against the debt balance.
EBITDA and projected operating cash flows remain unchanged. The higher cost of capital has reduced asset coverage below 100%.
The credit has already weakened before enterprise value falls below debt. At 10.5%, debt remains fully covered, but the equity cushion has fallen from 200 to approximately 59. Creditors have less protection against the next valuation or earnings decline.
The example changes the cost of capital, not the risk-free rate directly. The actual transmission depends on changes in credit spreads, equity risk premiums, financing weights and tax treatment; a 100bp rise in government yields need not produce a 100bp increase in WACC.
The good, the bad and the subordinated - where creditor losses arise
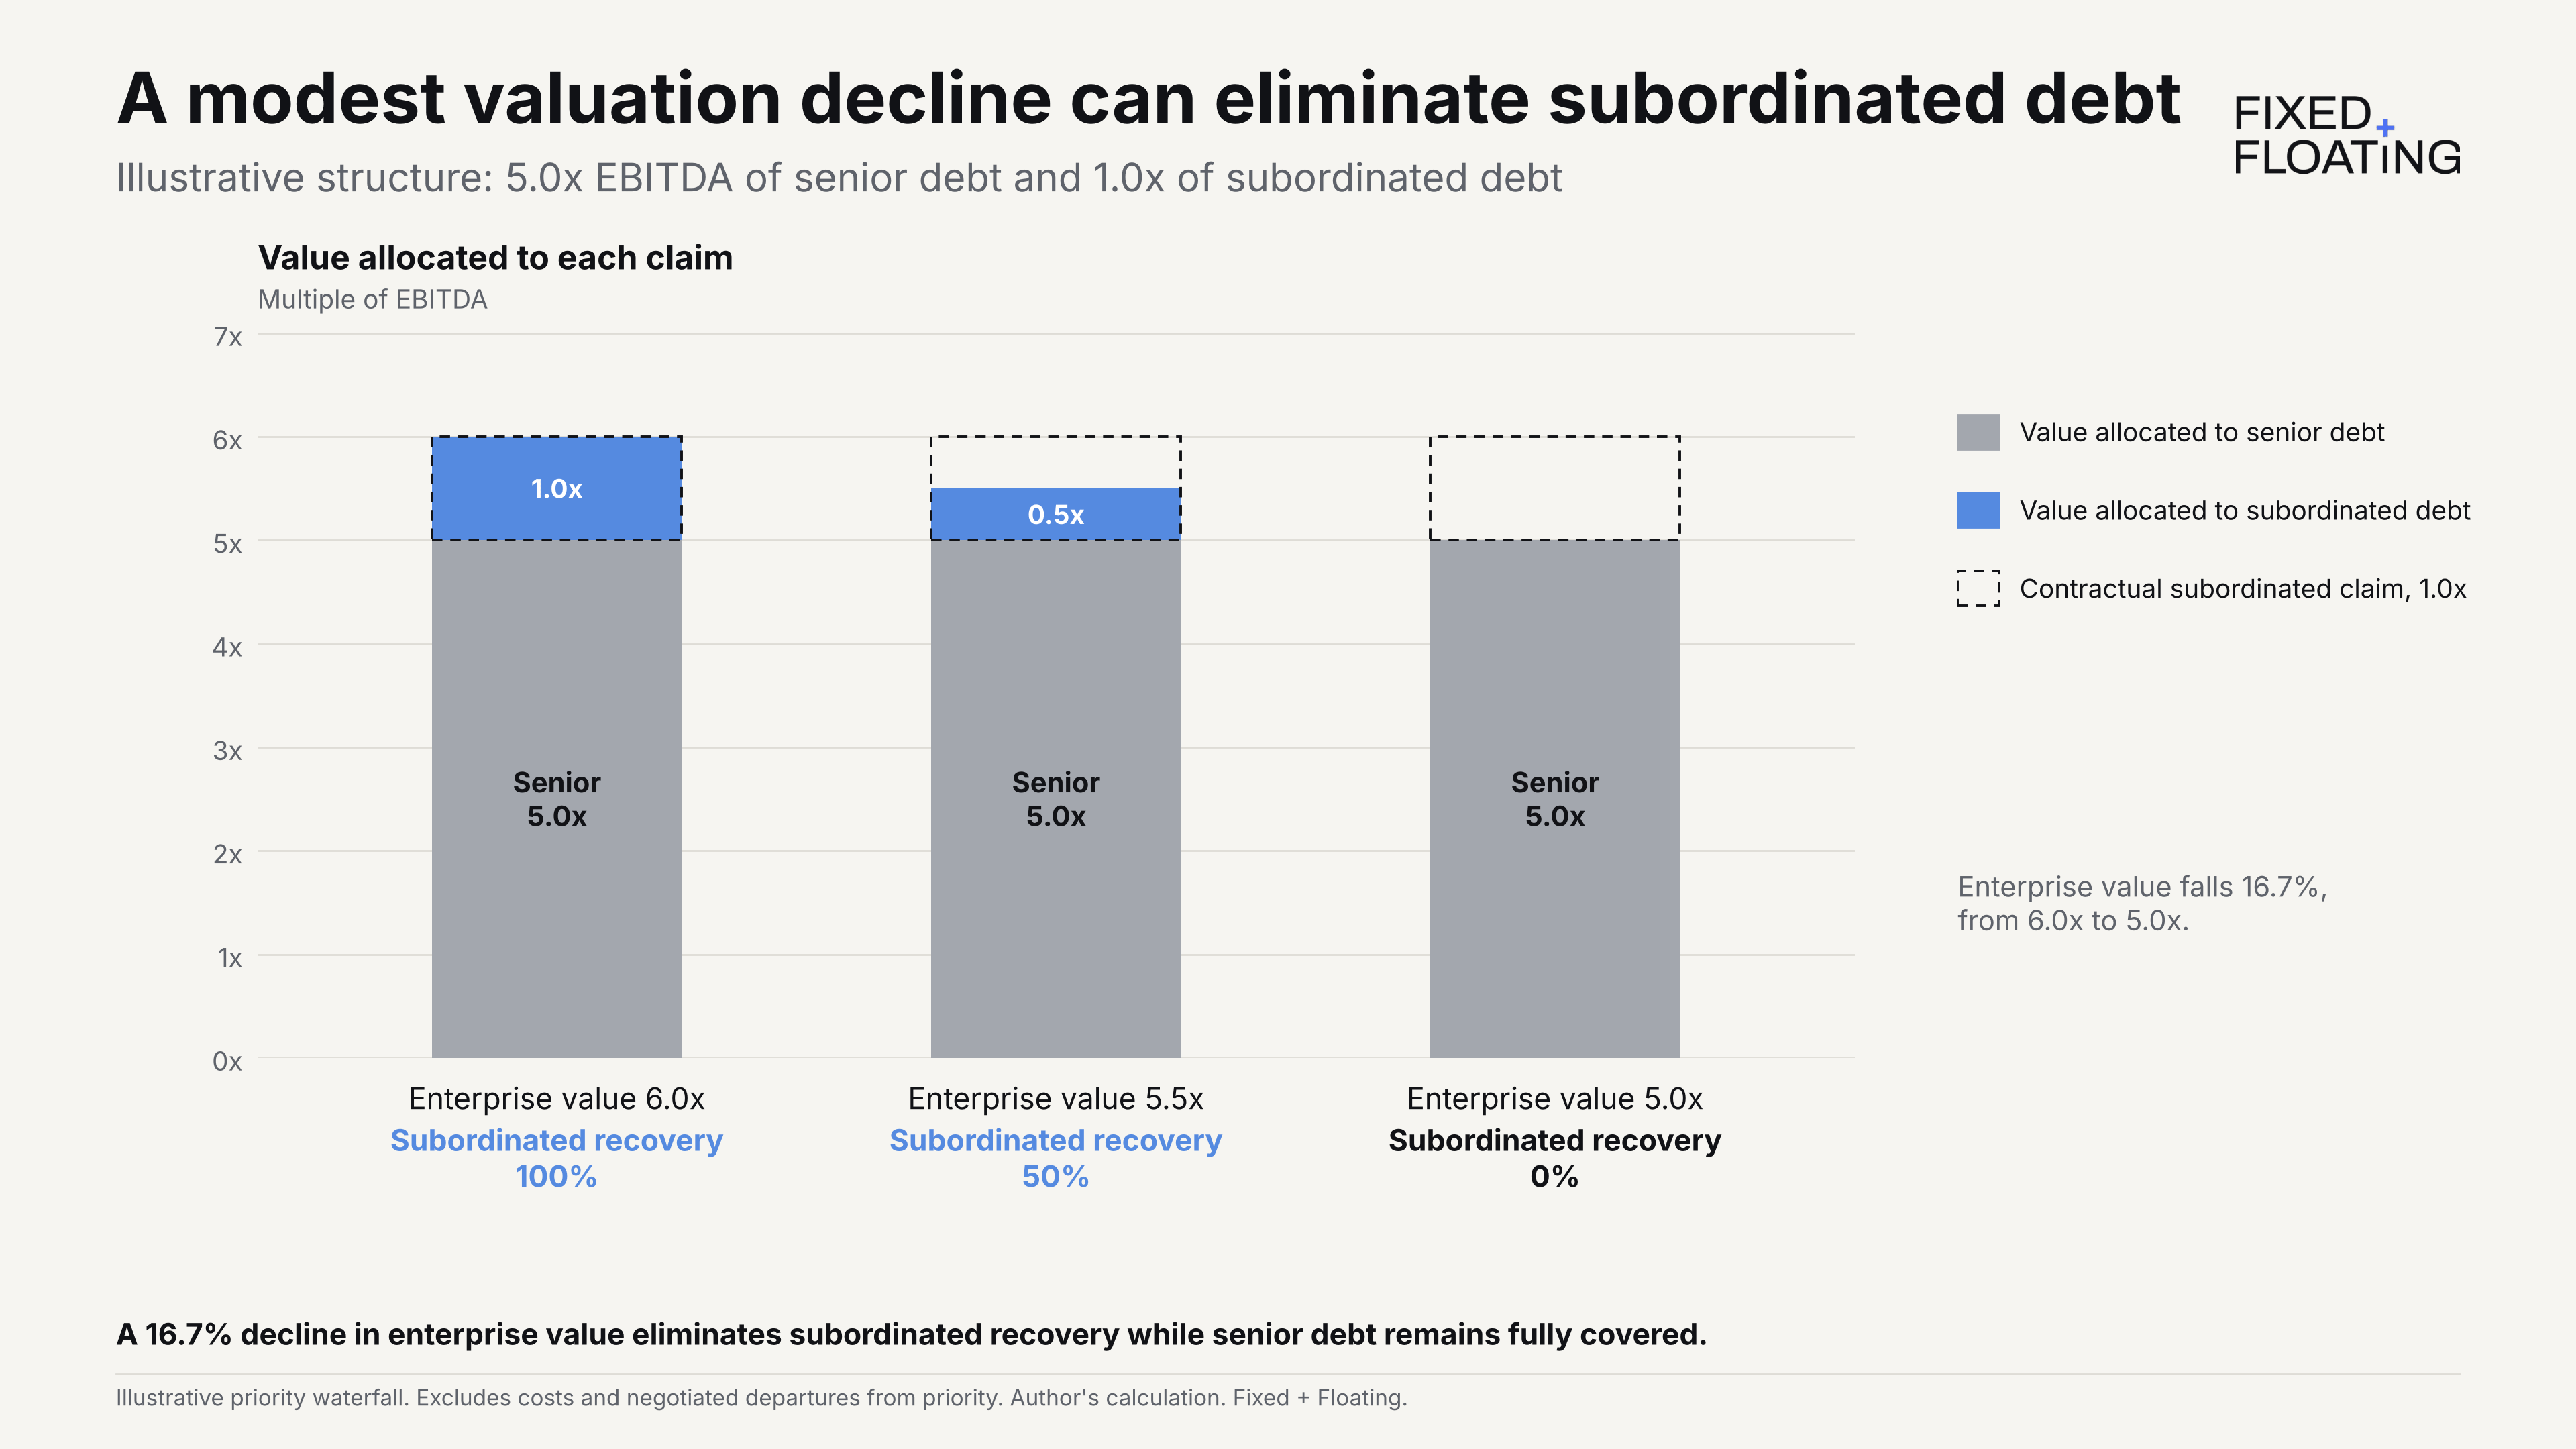
The valuation loss is allocated according to creditor ranking. A subordinated CCC security in a larger capital structure can suffer a complete loss while senior debt remains fully covered.
Consider 5.0x EBITDA of senior debt and 1.0x of subordinated debt. At 6.0x enterprise value, both claims are fully covered in a restructuring. At 5.5x, the subordinated claim receives a recovery of 50% of its claim. At 5.0x, the recovery is 0%.
If we assume, the business is worth 6.0x EBITDA initially, a 16.7% decline in enterprise value eliminates subordinated recovery while leaving senior debt fully covered. The decline in asset value could either come from a reduction in profit growth prospects (lower multiple) or lower profits (lower EBITDA) or both.
A higher issuer rating does not protect the junior claim. Recovery depends on the residual value after senior claims have been satisfied and the value of any post reorg debt or equity received in a restructuring.
A series of unfortunate credit events -default risk and recovery
The credit triangle links the credit spread to two inputs: default risk and recovery.
Here, λ is the default intensity implied by market prices, and R is the assumed recovery if default occurs. The spread compensates investors for default risk and the loss they would suffer. If default becomes more likely (λ increases), the spread should widen. Likewise, if expected recovery falls (R decreases), the loss given default increases and the spread should widen. This is a simplified CDS-pricing relationship, not a direct forecast of realised defaults.11
Higher interest rates can affect both inputs. A higher refinancing rate reduces the amount of debt the business can sustainably service, increasing the risk of restructuring or default. A higher discount rate reduces enterprise value, holding projected cash flows constant, and can lower recovery.
For floating-rate borrowers, cash interest costs change as the reference rate resets, subject to contractual floors, reset periods and hedging.
An illustrative 800bp spread over a 0% underlying rate implies an 8% financing cost. The same spread over a 5% rate implies 13%. With unchanged cash flow and the same coverage requirement, that increase reduces debt capacity by 38.5%.
An unchanged spread can coexist with a substantial deterioration in financing capacity.
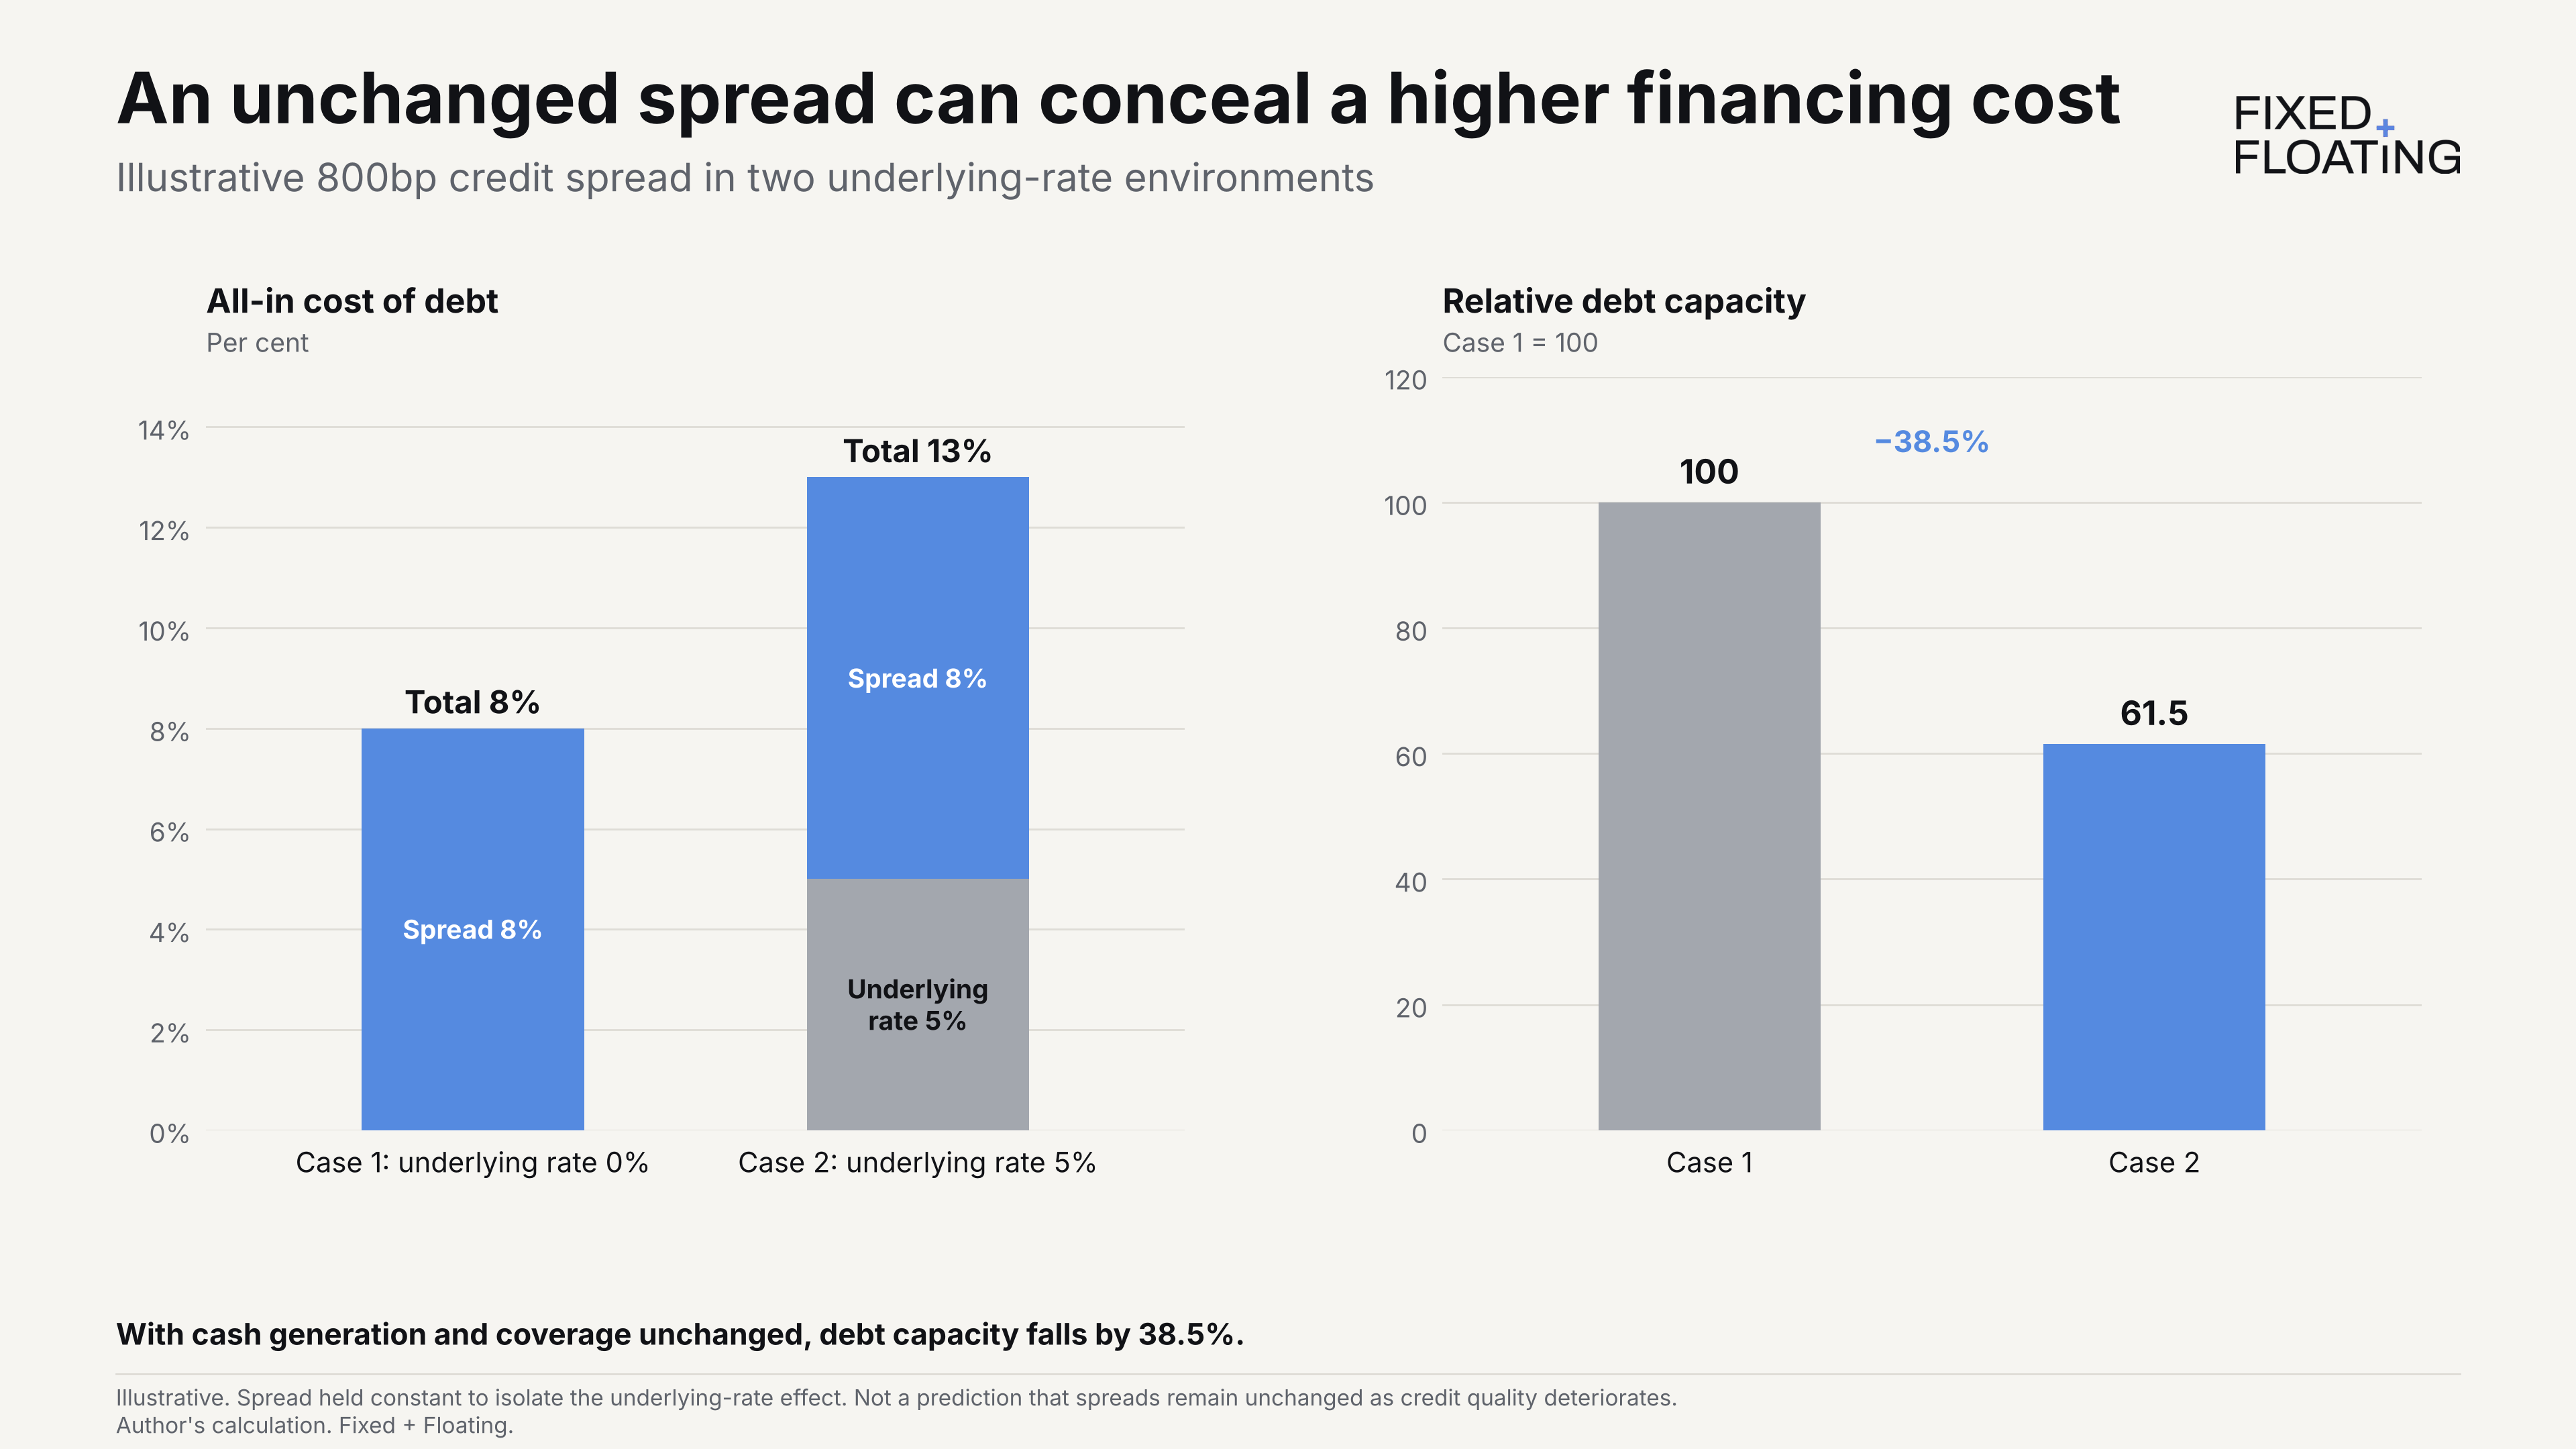
The example holds the spread constant to isolate the underlying-rate effect; it does not predict that the spread would remain unchanged after the borrower’s credit profile deteriorates.
Par fiction — valuing repayment, restructuring and default
Contractual yield to maturity assumes receipt of every scheduled coupon and repayment of principal at par.
When restructuring or default is a material possibility, yield is an imprecise yardstick for an investor’s expected return.
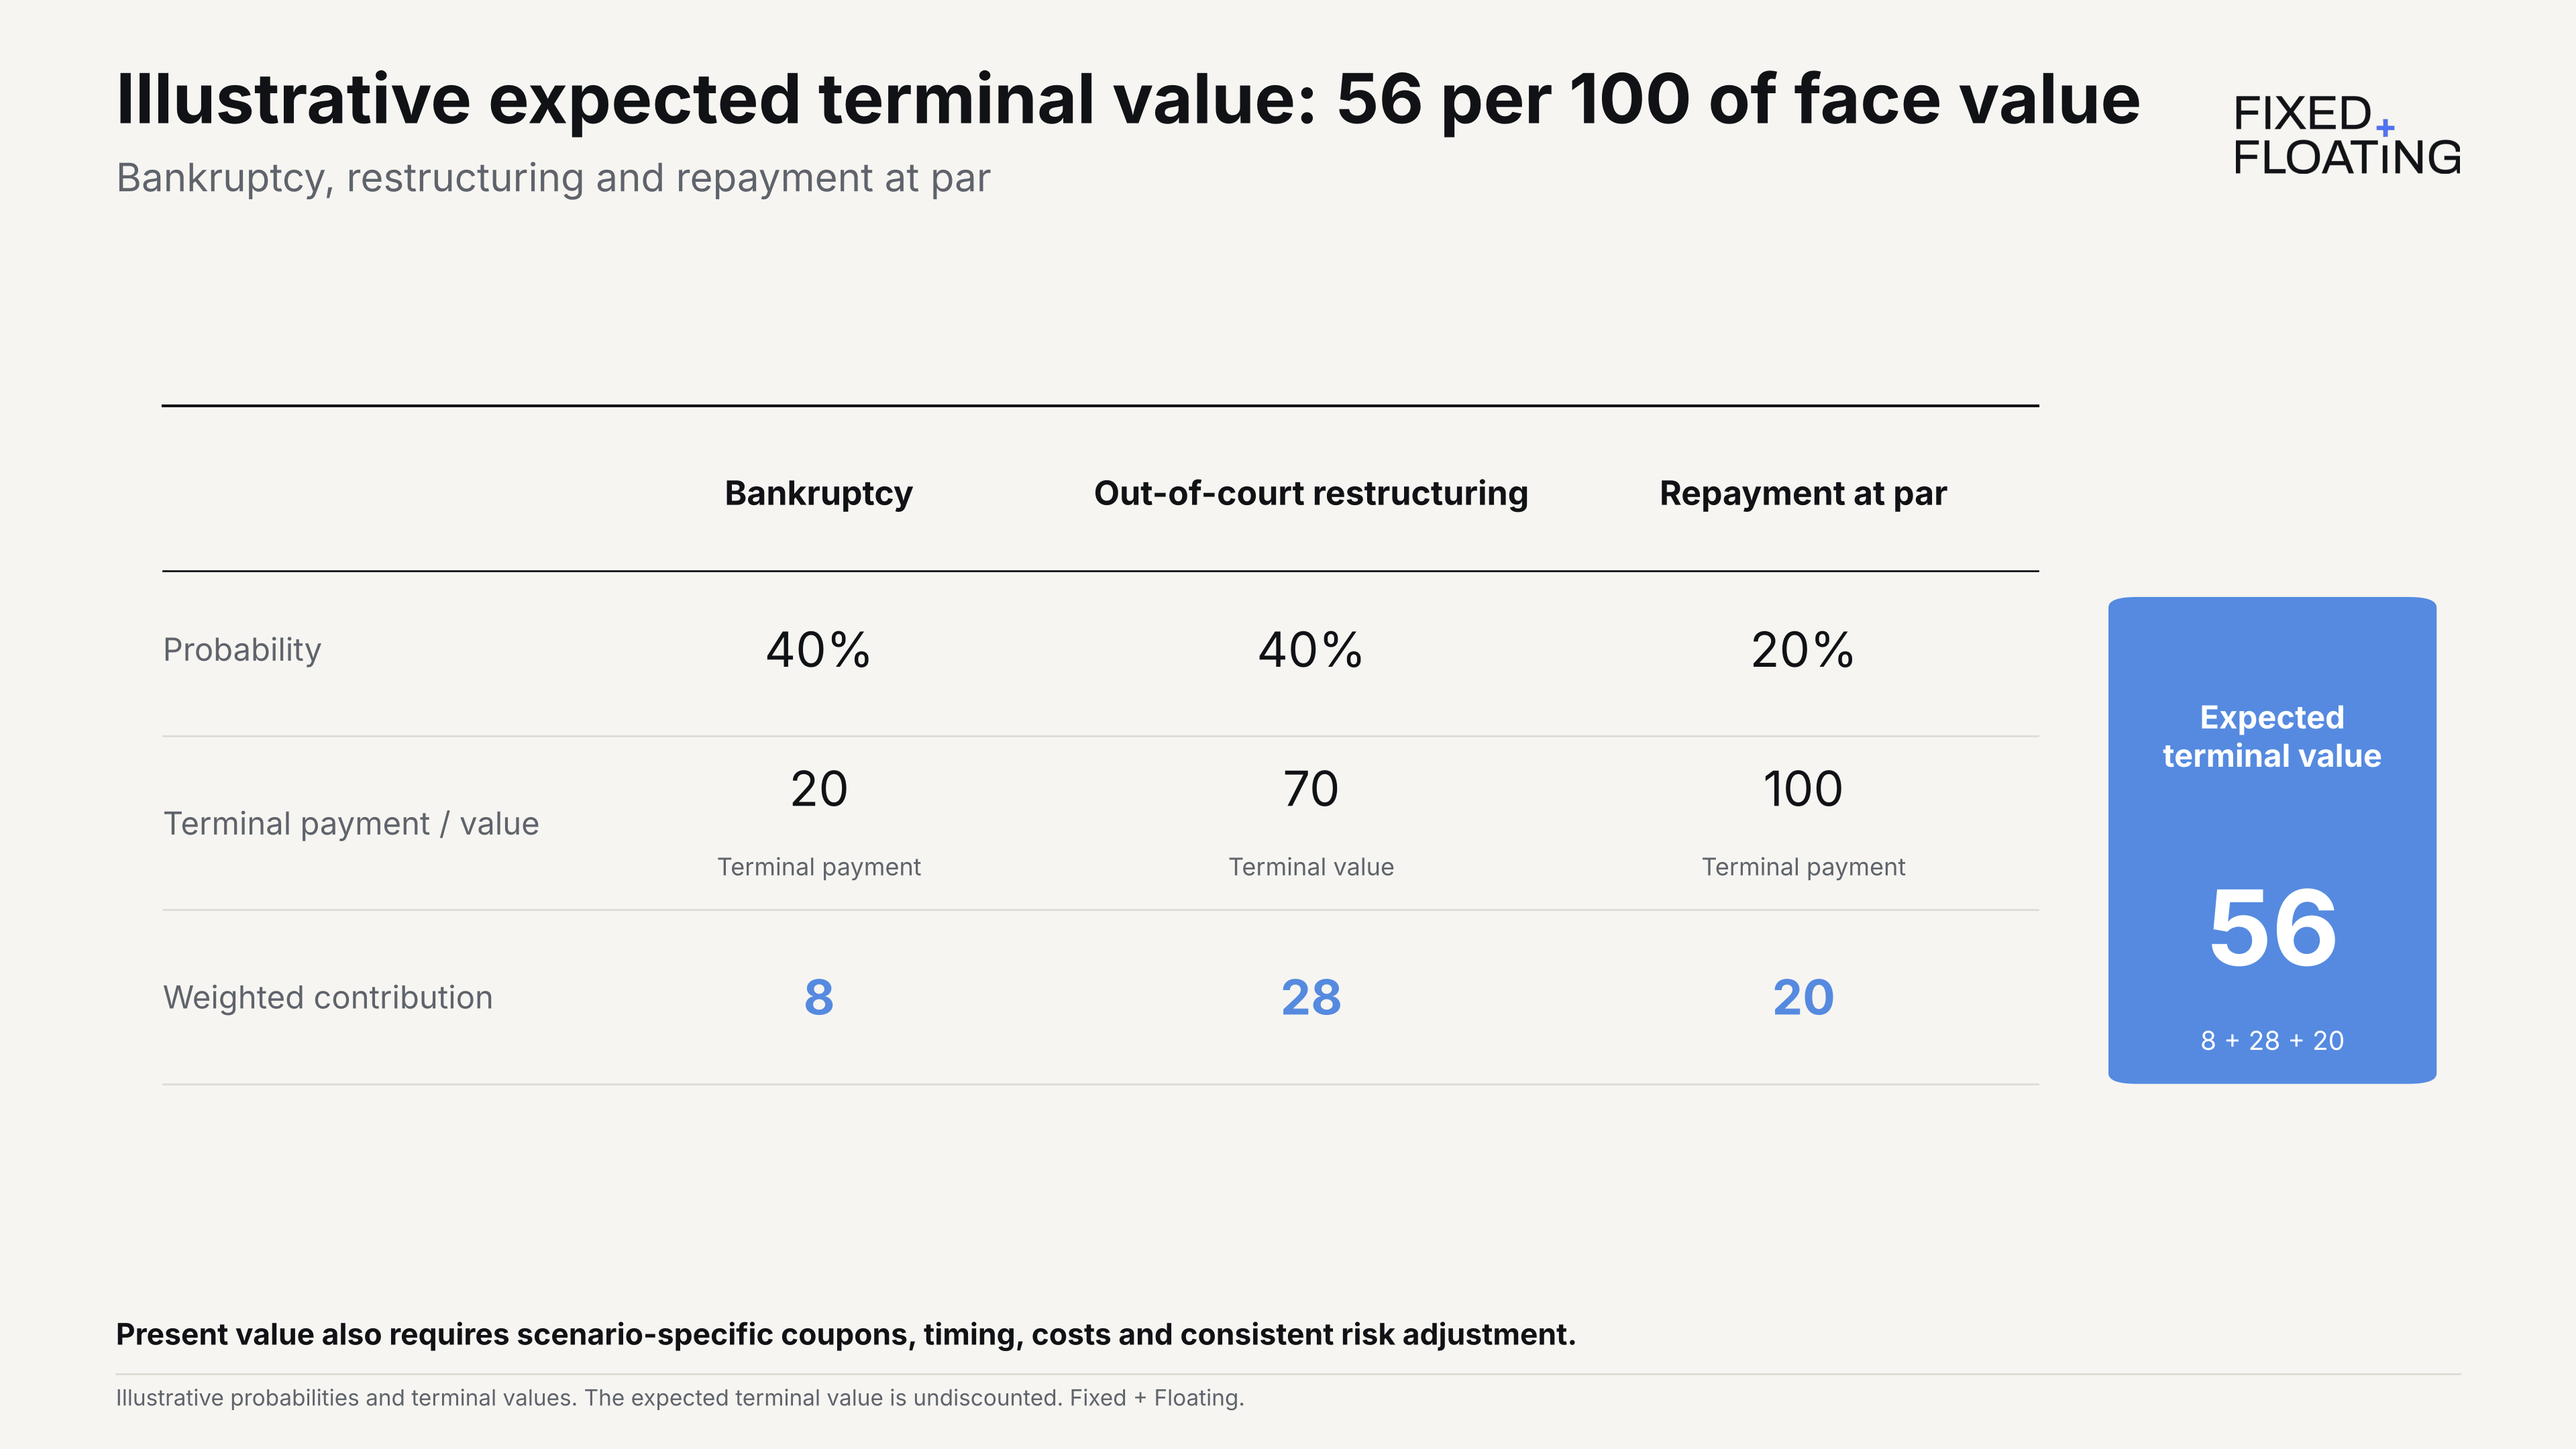
Take three illustrative outcomes:
Bankruptcy: 40% probability and terminal payment of 20.
Out-of-court restructuring: 40% probability and terminal value of 70.
Repayment at par: 20% probability and terminal payment of 100.
The probability-weighted terminal value is:
The probability-weighted terminal value is 56 per 100 of face value. But 56 is not today’s fair price: it is an undiscounted expected terminal value. To value the debt today, we also need to account for any coupons received under each outcome, the timing of payments, restructuring costs and an appropriate discount rate. If a restructuring delivers replacement debt or equity, the relevant recovery is the economic value of that package—not its nominal amount.¹⁰
Higher rates can reduce both the probability of repayment at par and the value received in restructuring. The scenario analysis should model those changes explicitly.
The put who loved me — the option embedded in corporate debt
I’m not a particularly quanty guy, but I find it useful to consider aspects such as asset volatility when thinking about the right value for different parts of the capital structure.
In Merton’s simplified model, equity is a call option on firm value. Debt is a risk-free bond minus a put option on firm value.12
Simplified, if the asset value rise, the option of the call increases and the put option becomes worth less (which is positive for equity and credit). If the volatility of the asset increases, as the range of outcomes increases, put and call gain in value, which is positive for equity but negative for credit.
Let V denote the value of the firm’s assets, D the promised debt payment at maturity, and B the value of the debt. The subscripts indicate the date: t is today and T is maturity.
At maturity, creditors receive the asset value if it is below the promised payment, or the promised payment in full if the assets are worth more:
Before maturity, debt is worth the present value of the promised payment minus the value of the put:
Here, Pₜ is the put’s value today, r_f is the risk-free rate, and T − t is the remaining time to maturity. This representation assumes a single payment at maturity (zero-coupon bond).
Holding the other inputs constant, a higher asset value increases the value of equity’s call and reduces the value of the put embedded in debt. Both shareholders and creditors gain. Higher asset volatility has a different effect: it increases the value of both options. Equity gains because shareholders own the call. Debt loses because creditors are short the put. At unchanged asset value, higher volatility therefore transfers value from creditors to shareholders.
The put has positive gamma. Debt, which is short that put, has negative gamma with respect to firm value.
As firm value falls towards the default boundary, debt becomes increasingly sensitive to further valuation losses. At high firm values, incremental value predominantly belongs to equity. Far below the boundary, debt increasingly behaves as a claim on the remaining assets.
The transition between debt that is likely to be repaid in full and debt that is likely to suffer a loss is not a sharp cutoff. Higher asset volatility or more time until maturity makes that transition more gradual: there is a wider range of firm values over which repayment remains uncertain. Within this range, the debt’s sensitivity to changes in firm value changes most rapidly—this is where its negative gamma is greatest in magnitude. That point is generally near the default boundary, but it does not necessarily occur exactly where the firm’s asset value equals the debt’s face value.
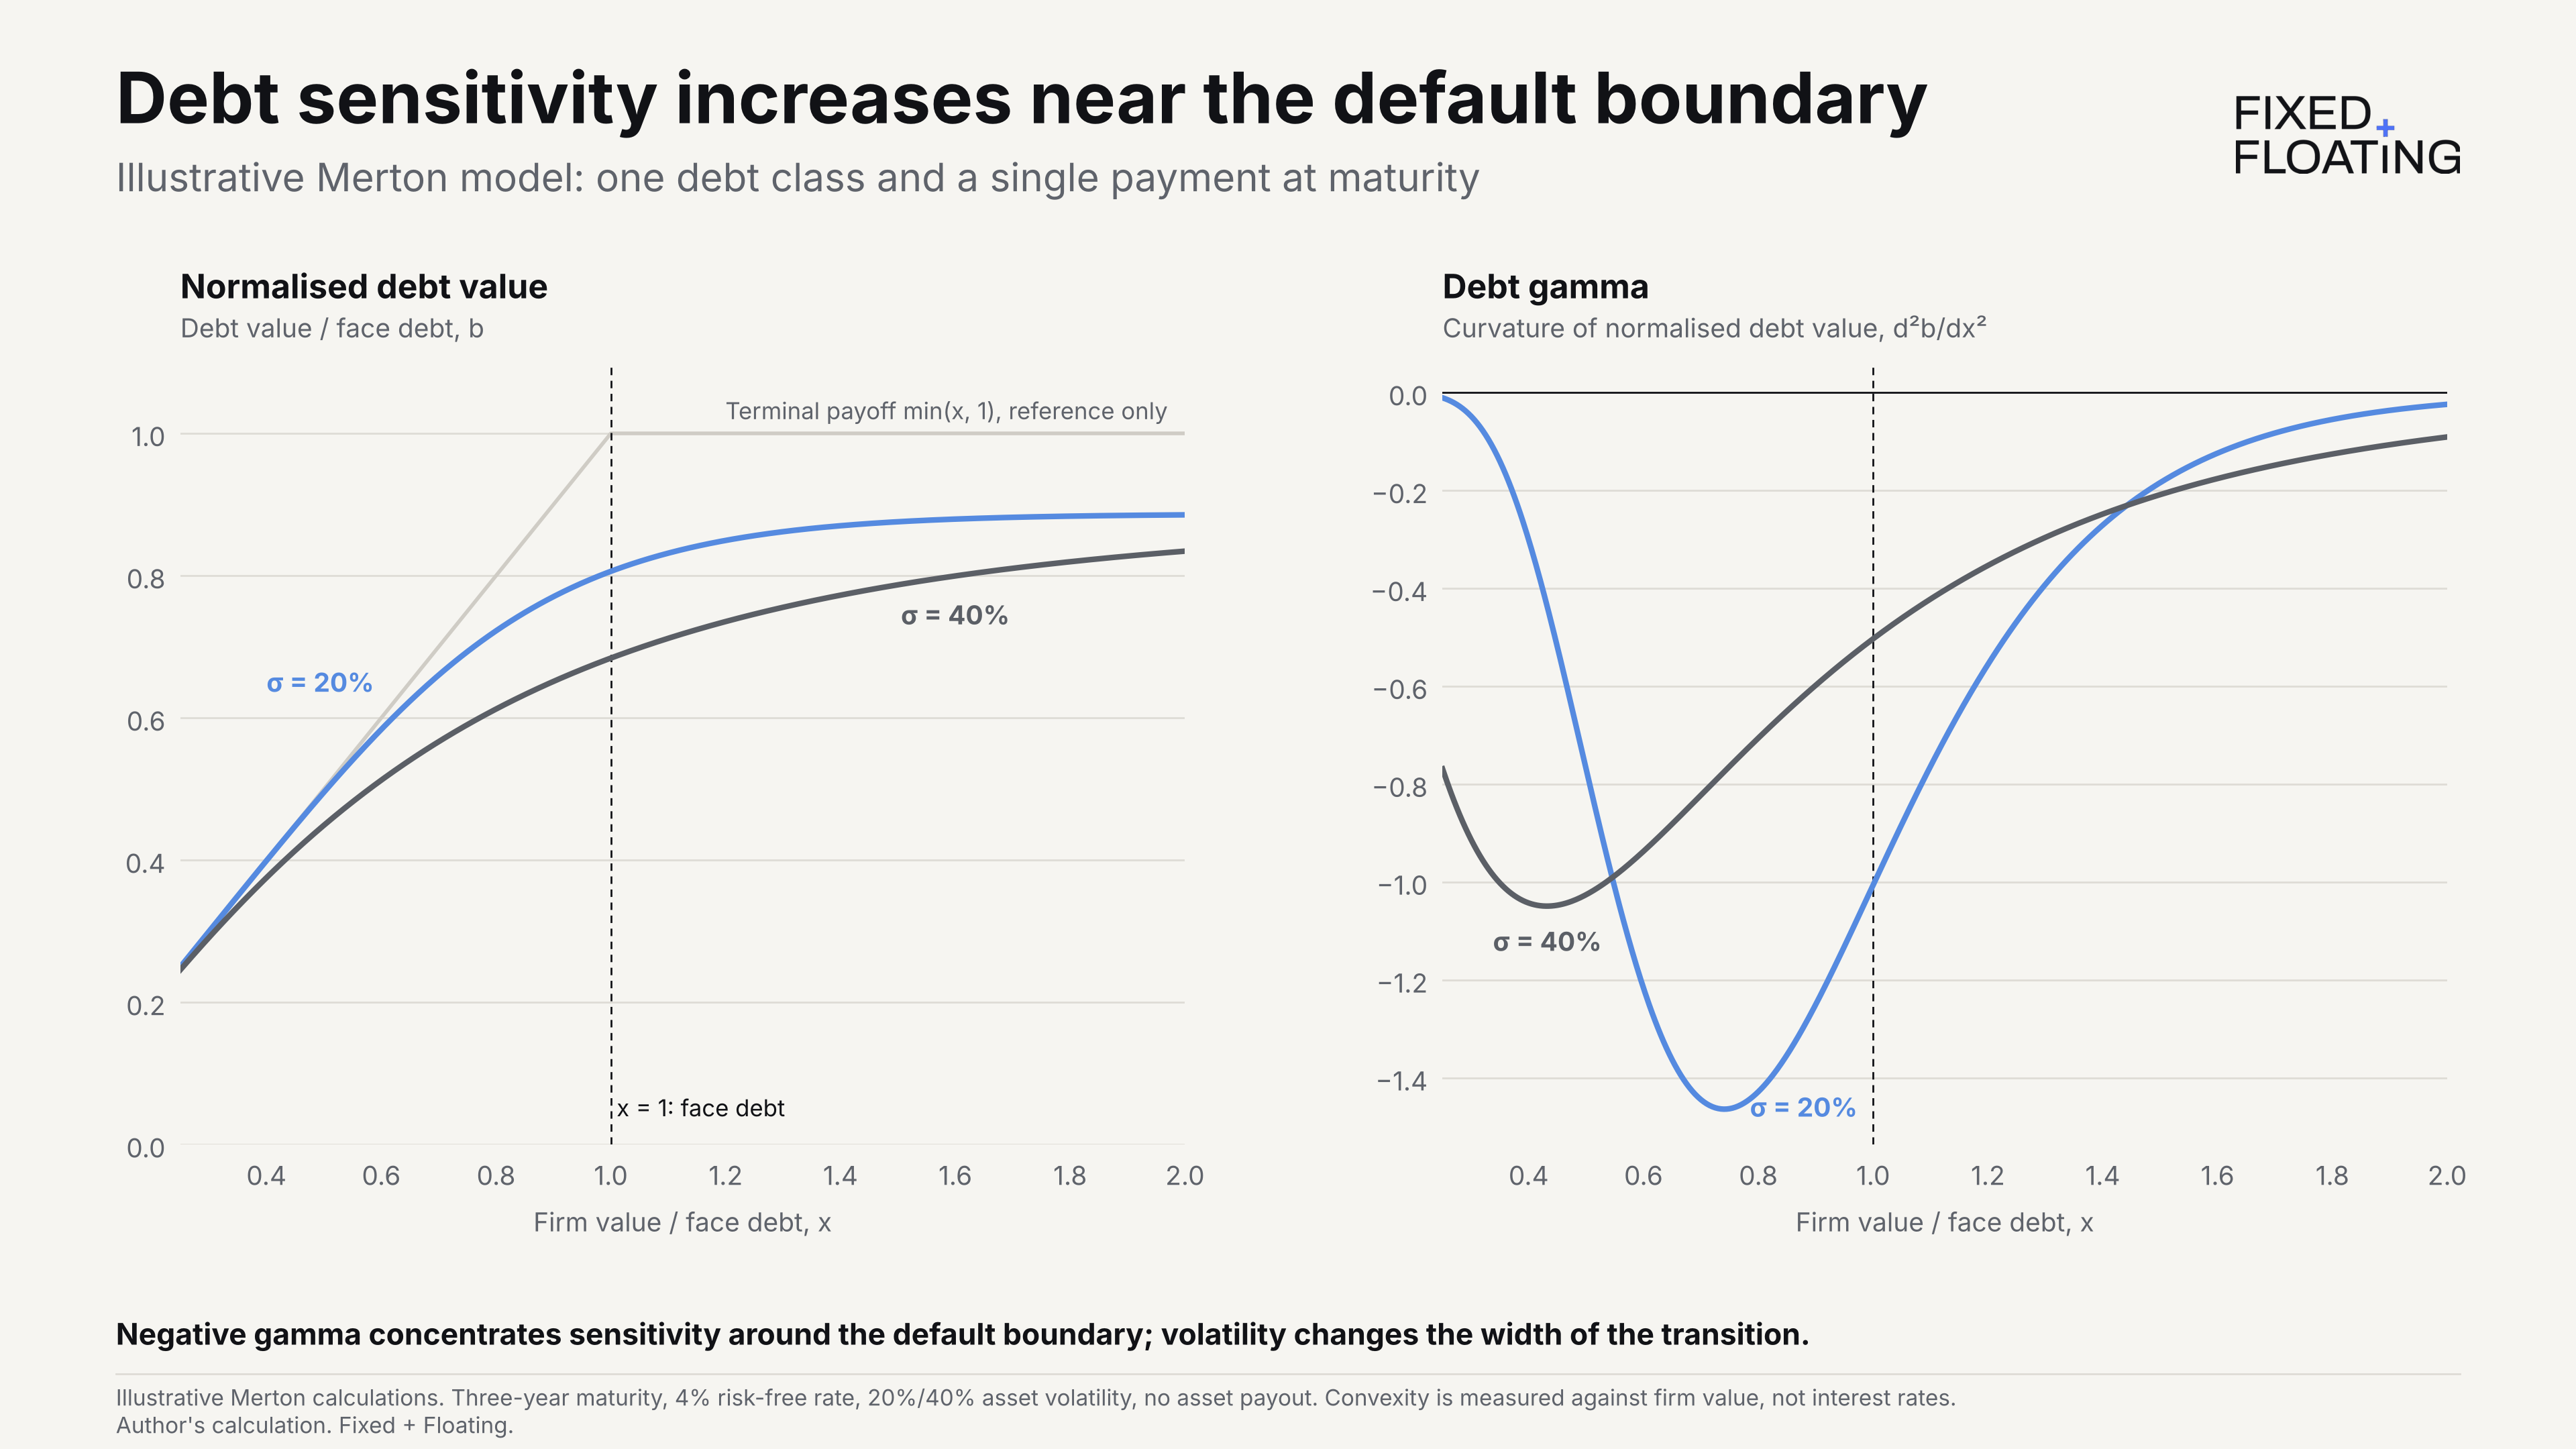
Higher required returns reduce enterprise value, all else equal. The resulting valuation decline has a larger credit effect when the borrower starts with a small equity cushion. The Merton framework explains that increasing sensitivity.
Higher refinancing costs add a separate cash-flow constraint: the borrower may be unable to refinance the existing debt even before a valuation model puts enterprise value below debt.
If you want more insight into how I think about option pricing in the context of credit—specifically LMEs—check out...
Why Creditors Pay Equity in an LME

In June 2020 Hertz was in Chapter 11. Its unsecured bonds were trading around 40 cents. Its shares still had a positive price.
Show me the money — underwriting the refinancing
The CCC-minus-B differential is not necessarily an early-warning signal for the rest of high yield. It can also reflect a more concentrated problem: capital structures that cannot support their existing debt at today’s financing costs.
Higher refinancing rates reduce debt capacity, while higher discount rates erode the equity cushion protecting creditors. Borrowers with less leverage and stronger cash generation can absorb changes that force more fragile structures into restructuring. Stress at the bottom therefore need not produce comparable widening further up the ratings spectrum.
Lower financing costs would help—but the reason they fall matters. Disinflation with resilient cash flows can restore debt capacity. Rate cuts accompanied by deteriorating earnings may not.
CCCs are warning that some capital structures no longer work. Whether that problem remains concentrated—or extends further into leveraged finance—is the question for Part II.
Notes
BofA Global Research and ICE Indices LLC, US high-yield senior non-financial bonds, option-adjusted spreads by broad rating; observations through 30 September 2026. Market levels and rating weights are taken from the dataset underlying the accompanying graphics. Rating weights are measured by market value.
XAIA Investment, Quarterly Letter 2024|01, “Higher rates bring credit raiders to Europe.” The letter discusses the valuation and financing effects of higher interest rates on leveraged capital structures.
Author’s calculations reported in the accompanying graphics: regressions of monthly changes in the CCC-minus-B spread differential on monthly changes in the 10-year Treasury yield, using FRED series DGS10. Samples: 2014–2021 and 2022–September 2026. Coefficients are scaled to a 100bp yield change. These are uncontrolled associations, not identified causal effects. The supporting rolling analysis uses 12-month windows and excludes March–April 2020.
S&P Global Ratings, “Altice USA Inc. Downgraded To ‘B-’ From ‘B’ On Lagging Credit Metric Turnaround; Outlook Stable,” 21 February 2024.
CreditSights, “Altice USA Debt Tumbles as Management Hints at Potential LME, Creditor Group Swells,” 3 May 2024.
S&P Global Ratings, “Altice USA Inc. Downgraded To ‘CCC+’ On Capital Structure Sustainability Concerns,” 15 May 2024. The approximately $500 million free-operating-cash-flow comparison assumes capex reduced to approximately $1.2 billion; it is not the forecast at planned capex. Secondary-market yields are not executable refinancing terms.
S&P Global Ratings, “Optimum Communications Inc. Downgraded To ‘CCC’,” 8 June 2026. The downgrade cited increased refinancing risk around approximately $6.2 billion of 2027 maturities.
Reshmi Basu, “Creditors Sue Optimum, Patrick Drahi Alleging ‘Fraudulent’ Deal-Making,” Bloomberg, 28 September 2026. The reporting describes creditor allegations, not established judicial findings.
John R. Mills and Jeanne H. Yamamura, “The Power of Cash Flow Ratios,” Journal of Accountancy, October 1998. Cash interest-coverage definitions differ. This article defines its numerator as cash remaining after capex, working-capital requirements and cash taxes, before cash interest. The 1.25x requirement is illustrative, not a universal lending standard.
Moody’s, Distressed Exchanges in Europe. The value received in a distressed exchange depends on the allocation and economic value of the replacement securities, including the effect of seniority.
The credit triangle is a simplified market-pricing relationship between CDS spread, risk-neutral default intensity and assumed recovery. Market-implied default intensity is not a forecast of realised defaults; the relationship should not be treated as an exact decomposition of a distressed cash-bond spread.
R. C. Merton, “On the Pricing of Corporate Debt: The Risk Structure of Interest Rates,” Journal of Finance 29 (1974), 449–470. The simplified framework uses firm asset value, one debt class and repayment at maturity. To relate operating enterprise value to the model’s asset value, assume no surplus cash, non-operating assets or additional claims outside the modelled debt.
All debt-capacity, valuation, subordination and scenario examples are illustrative. The financing calculation holds cash generation and cash taxes constant and excludes amortisation, fees and the incremental interest tax shield. The valuation calculation holds next-period unlevered free cash flow and growth constant. Neither is a complete refinancing or restructuring valuation.
Altice USA, “Altice USA Reports First Quarter 2024 Results,” 2 May 2024, section “Debt Maturities Addressed Near Term.” Documents the $2.05 billion 11.75% guaranteed-note issuance and the $750 million revolver draw.
Aswath Damodaran, “Discounted Cashflow Models: What They Are and How to Choose,” NYU Stern, section on firm valuation using free cash flow to the firm and weighted average cost of capital.
Octus, “Optimum Likely Dropped Down Conn., NJ, Most of Its NYC Area Assets in Unrestricted Subsidiary Transaction,” 5 December 2025. Describes the November refinancing sequence, removal of B-6-specific protections and JPMorgan Chase Funding’s financing role.
Optimum Communications, Form 8-K, filed 29 May 2026, describing the internal reorganisation and unrestricted-subsidiary structure.
Optimum Communications, “Optimum Launches Effort to Drive a Consensual Repositioning of its Capital Structure,” 1 June 2026.optimum
Fixed + Floating
Fixed + Floating is a credit podcast hosted by Portfolio Manager Josef Pschorn. Long-form conversations with credit market practitioners - portfolio managers, analysts, restructuring advisers and academics - on private credit, high yield, distressed debt, CLOs, liability management and credit policy.
Subscribe to Fixed + Floating on YouTube · Spotify · Apple Podcasts
Follow Fixed + Floating on X · Fixed + Floating on LinkedIn
Follow Josef on LinkedIn
If there is a guest or a topic you want covered, reply to this post or message me on LinkedIn.
Fixed + Floating is for informational purposes only. Not investment, legal or tax advice. Guest views are their own and do not represent their employer.